


НаШЧЪЊ
ЅэЅАЅЄЅѓ
MAIN MENU
ЅЊЁМЅзЅѓЅеЅЁЅЄЅы
File No119ЁЇvol.127, no. 12
ЯРРтЁЇХЅЅРЅЄЅЂЅдЅыМўЪеЄЮКеЖ§ДфЬЎЄЮЪ§АЬВђРЯЄЫЄшЄыЙАшБўЮЯЄШЖЩНъБўЮЯЄЮИЁНаЁЇУцПЗХ§ХФЪеСиЗВЄЮЮу
АТюДЗМЬРЁІКДЦЃГшЛж
ЁЪvol.127, no.12, p.709-725ЁЫ
- Appendix Table 1. Clastic dike data: lithofacies, sub-area, azimuth (clockwise angle from N after correction for declination), and dip.
- Appendix Table 2. Paleostress analysis data: material, sub-area, detected stress name, azimuth and plunge, and mixing coefficient. Plots are shown in Figures 7–10.
File No118ЁЇvol.127, no. 12
ЯРРтЁЇЛЭЙёЛЭЫќННТгЅЋЅыЅЕЅЄЅШЬЎЄЮЦБАЬТЮСШРЎЄЋЄщЄпЄПФРЄпЙўЄпТгУЯПЬШЏРИПМХйЄЮЮЎТЮЄЮЕЏИЛ
ЦтХФКкЗюЁІТМЛГВэЛЫЁІООИЖЭЇЕБЁІКфИ§ЭПЭ
ЁЪvol.127, no.12, p.701-708
- Fig. A1. Locations of vein samples with annotations corresponding to sample numbers in Table 1. Base maps are partly modified from the Digital Topographic Map (Geospatial Information Authority of Japan).
File No117ЁЇvol.127, no. 11
ЯРРтЁЇЫЬОхЛГУЯУцРОЩєЄЮУцИХРИТхЩеВУТЮЄђДгЄЏЧђАЁЕЊДфЬЎЗВЄЮДфСъЁІЧЏТхЄШДгЦўБў ЮЯВђРЯЄЋЄщЦРЄщЄьЄПАњФЅОь
ЦтЬюЮДЧЗЁІБЉУЯНгМљ
ЁЪvol.127, no.11, p.651-666ЁЫ
- Table A1-A3.
- Table A1. Detailed information for dike outcrops. Abbreviations: ND (Nedamo Belt); NK (North Kitakami Belt); R. (River); and S. (Stream).
- Table A2. Instrumentation for LA–ICP–MS analyses.
- Table A3. U–Pb isotopic data for zircons recovered from the rhyolite. Abbreviations: 2nd st. (secondary standard zircon); and Disc. (discordant data).
File No116ЁЇvol.127, no. 10
ЯРРтЁЇЫЬЩєЖхНЃЁЄМмГйЫЬЩєЄЫЛКЄЙЄыВаРЎДфЮрЄЮЧЎПхЪбМСКюЭбЄШЪЌВНЁІНИРбКюЭбЄђШМ ЄІКЎЙчКюЭбЄЫЄЊЄБЄыСШРЎЪбВН
ЙОХчЗНЭД
ЁЪvol.127, no.10, p.605-619ЁЫ
File No115ЁЇvol.127, no. 10
ЯРРтЁЇЛЭЙёРОЩєУцПЗХ§ЕзЫќСиЗВЄЮЛРРЖХГЅДфЄЮЅИЅыЅГЅѓU–Pb ЧЏТх
ПЗРЕЭЕОАЁІРоЖЖЭЕЦѓ
ЁЪvol.127, no.10, p.595-603ЁЫ
- Table S1. Summary of LA–ICP–MS operating conditions.
File No114ЁЇvol.127, no. 9
ЯРРтЁЇГЗСУюВНРаЗВНИЄЫД№ЄХЄЏПЗГуИЉПЗФХЕжЮЭЫЬЩєАшЄЮЙЙПЗРЄЄЮИХДФЖЪбВН
ЛГХФЁЁЗЫЁІЦяЁЁЗХЛвЁІШгХФЮЄКкЁІЕзПмШўкяЩз
ЁЪvol.127, no.9, p.575-591ЁЫ
- Table S1. Occurrence list of fossil ostracods from the Niitsu Hills, Niigata Prefecture, central Japan.
File No113ЁЇvol.127, no. 9
ЯРРтЁЇЛЭЙёЫЬРОЩєЁЄУцПЗХ§ЕзЫќСиЗВЬРПРСиЄЫДоЄоЄьЄыВаРЎДфуЊЄЮЕЏИЛ
СъХФЯТЧЗЁІВМВЌЯТЬщЁІУЋЁЁЗђАьЯКЁІЦяЖЖЁЁФОЁІѓюЦЃЁЁХЏ
ЁЪvol.127, no.9, p.563-574ЁЫ
File No112ЁЇvol.127, no. 9
ЯРРтЁЇХђЅЮТєЅЋЅыЅЧЅщЁЄШјГЋЛГЖХГЅДфЄЮЙтРКХйЁІЙтГЮХйЪЎНаЧЏТхЄЮЗшФъ
ХФИ§НеЦсЁІРоЖЖЭЕЦѓЁІКДЁЙЬкМТЁІЕмХшЭЄХЕЁІДфЬюБбМљЁІЪПХФГйЛЫ
ЁЪvol.127, no.9, p.545-561ЁЫ
- Table A1.Results of K–Ar age dating of the Obirakiyama Tuff, Yunosawa Caldera. Data sources: 1) Muraoka and Hase (1990); 2) Muraoka (1991); 3) Metal Mining Agency of Japan (1980); and 4) Nemoto (1998).
- Fig. A1. Particle size distributions of zircon crystals recovered from five samples of the Obirakiyama Tuff, Yunosawa Caldera.
File No111ЁЇvol.127, no. 8
ЪѓЙ№ЁЇЖхНЃЦюЩєЄЮТчЖљВжжОСЎЮаДфТЮЄЫШЏУЃЄЙЄыРсЭ§ЗЯ
ЭЮБРщЧюЁІЛГЫмЗМЛЪ
ЁЪvol.127, no.8, p.489-495ЁЫ
- Table A1. Strike and dip of joints in the Osumi granodiorite batholith. See Fig. 3 for location.
File No110ЁЇvol.127, no. 8
ЯРРтЁЇЛГБЂТгХчКЌИЉБРЦюУЯАшЄЫЪЌЩлЄЙЄыТчХьВжжОСЎЮаДфЄЮВаРЎГшЦА
ЬюИ§ОЛжЁІЕЕАцНпЛжЁІЮыЬкЧюШўЁІОЎЮгВЦЛв
ЁЪvol.127, no.8, p.461-478ЁЫ
- Appendix 1. Lithofacies distribution within the study area. Base topographic map provided by the Geospatial Information Authority (GSI) of Japan [URL2].
- Appendix 2. Whole-rock and modal compositions and values of magnetic susceptibility for the Daito granodiorite, Hiyodori granite, and Mue granite.
- Appendix 3. EPMA data for plagioclase, hornblende, and biotite in the Daito granodiorite.
- Appendix 4. EPMA data for magnetite in the Daito granodiorite.
- Appendix 5. Partition coefficients and starting compositions utilized in the Rayleigh fractionation modeling.
File No109ЁЇvol.127, no. 8
ЯРРтЁЇЫЬЩєЖхНЃХьЩєЄЫЪЌЩлЄЙЄыХФРюЪбРЎДфЮрЄЮЪбРЎКюЭб
ЭЎИЖВэМљЁІРЖБКГЄЮЄЁІЦќќтЫќшНАЁЁІГАХФУвРщЁІСсКфЙЏЮД
ЁЪvol.127, no.8, p.447-459ЁЫ
- Appendix 1. LA-ICP-MS U-Pb age data for zircon samples from the Tagawa metamorphic rocks (sample 14060710).
File No108ЁЇvol.127, no. 7
ЅьЅПЁМЁЇРФПЙИЉЦюЩєЁЄФіЅіДиЅЋЅыЅЧЅщМчЭзЙНРЎЪЎНаЪЊЁЪЦњГЖХГЅДфЁЫЄЮЅИЅыЅГЅѓLAICP- MS U–Pb ЧЏТх
СъРюЭЕЕЎЁІРоЖЖЭЕЦѓЁІКДЁЙЬкЁЁМТЁІУцШјГЁЛЫЁІЙтЕзЭКАь
ЁЪvol.127, no.7, p.431-436ЁЫ
- Appendix 1. Bulk chemical composition of the Nijikai Tuff (sample no. 09081301).
File No107ЁЇvol.127, no. 7
ЯРРтЁЇЖсЕІУЯЪ§ЄЮРЅИЭЦтЖшЄЫЪЌЩлЄЙЄыВМ–УцЩєУцПЗХ§ЄЮРИСиНјЄШТаШц
ЦўЗюНгЬРЁІЬјТєЙЌЩзЁІЬкТМЫЈПЭЁІВУЦЃЗМВ№ЁІРБЁЁЧюЙЌЁІЮгЁЁЙМљЁІЦЃИЖЭДДѕЁІРжАцАьЙд
ЁЪvol.127, no.7, p.415-429ЁЫ
- Table A1. List of fossil ostracods from the Ayugawa and Tsuzuki groups.
- Table A2. List of fossil diatoms from the Ayugawa and Tsuzuki groups.
- Table A3. List of fossil diatoms from the Yamabe and Yamagasu groups.
- Table A4. List of fossil planktonic foraminifers from the Yamagasu Group.
- Table A5. Data sources for the stratigraphic correlation (Fig. 6) among the selected groups of the Miocene in the Setouchi Geologic Province. Abbreviations: D (diatom), PF (planktonic foraminifera), CN (calcareous nannofossil), R (radiolarian), O (ostracod), Sr (strontium isotope dating), FT (fission track dating), U–Pb (U–Pb dating), and M (magnetostratigraphy).
- Fig. A1. Photographs of diatom species from the Kaya Tuffaceous Mudstone Member of the Okuyamada Formation, Tsuzuki Group.
- Fig. A2. Photographs of diatom species from the Yamabe and Yamagasu groups (part 1).
- Fig. A3. Photographs of diatom species from the Yamabe and Yamagasu groups (part 2).
- Fig. A4. Photographs of diatom species from the Yamabe and Yamagasu groups (part 3).
File No106ЁЇvol.127, no. 6
ЯРРтЁЇПЗХчЁЪЧГХчЁЫЄЮИхДќЙЙПЗРЄЫіДќ–ДАПЗРЄЄЮРаГЅМСШљВНРаЗВНИЄШМЏЛљХчЯбБќЄЮИХ ДФЖЩќИЕ
САЩЭЭЊТРЁІМЏЬюЯТЩЇЁІТчЬкИјЩЇЁІЦўЗюНгЬРЁІЮгЁЁЙМљ
ЁЪvol.127, no.6, p.363-376ЁЫ
- Table A1. List of fossil benthic foraminifera species in each sample.
- Table A2. List of fossil planktonic foraminifera species in each sample.
- Table A3. List of fossil ostracod species in each sample.
File No105ЁЇvol.127, no. 6
НфИЁАЦЦтНёЁЇДєЩьИЉРОЩєЁІЭЌШхРюФЎНеЦќУЯАшЄЮВаРЎДфЄШРмПЈЪбРЎДф
БнЪТРЕМљЁІхіхђЭЄАсЁІВУЦЃОцХЕЁІФлАцД№ЭЕЁІУАБЉЗђЪИ
ЁЪvol.127, no.6, p.313-331ЁЫ
- Table S1. Representative analyses of major constituent minerals in a basic nodule collected from Stop 1d.
- Table S2 . Whole-rock compositions of lamprophyre collected from Stop 3.
File No104ЁЇvol.127, no. 5
ЅьЅПЁМЁЇDiscovery of Early Permian tonalite from the high P/T Triassic Suo Metamorphic Complex, Eastern Yamaguchi Prefecture, SW Japan
Kenta Kawaguchi et al
ЁЪvol.127, no.5, p.293-304ЁЫ
- Table S-1. LA-ICP-MS zircon U–Pb data of consistency standard sample YO1.
- Table S-2. LA-ICP-MS zircon U–Pb data of three tonalite mylonite samples.
- Table S-3. LA-ICP-MS detrital zircon U–Pb data of psammitic schist sample.
- Table S-4. XRF whole-rock chemical compositions of the four tonalite mylonite samples.
File No103ЁЇvol.127, no. 4
ЅьЅПЁМЁЇЗЇЫмИЉХЗС№ЛдЁЄСАХчВжжОСЎЮаДфЄЮЅИЅыЅГЅѓU–Pb ЧЏТх
ФЙХФНМЙАЁІТчЦЃЁЁЬа
ЁЪvol.127, no.4, p.237-243ЁЫ
- Fig. A1. a) Microphotograph of sample MGD-02 (crosspolarized light). Afs: Alkali feldspar, Bt: biotite, Pl: plagioclase, Qtz: quartz. b) Cathodoluminescence images of the concordant zircons separated from sample MGD-02. The diameter of each spot (with the spot number) is 25 μm. The yellow scale bar is 50 μm.
- Table A1. The LA-ICPMS analytical conditions for U–Pb dating in this study.
- Table A2. The U–Pb zircon data in this study. C (D): concordant (discordant) data.
File No102ЁЇvol.127, no. 2
ЯРРтЁЇЮаПЇЩсФЬГбСЎРаЄЮМчРЎЪЌЄЊЄшЄгШљЮЬРЎЪЌИЕСЧСШ РЎЄЫЄшЄыШўЩЭЅЦЅеЅщЄШЛЭЙёВMD012422 ЅГЅЂЄЋЄщИЁНаЄЕЄьЄПЅЏЅъЅзЅШЅЦЅеЅщЄШЄЮТаШцЄШ ЕыИЛЄЮПфФъЁЅ
ИХпЗЁЁЬРЁІКДЁЙЬкНгЫЁЁІИхЦЃЗћБћ
ЁЪvol.127, no.2, p.91-103ЁЫ
- Appendix 1. Glass composition data for StHz and ATHOG of MPI-DING. Abbreviations: average (Av.), standard deviation (SD), uncertainty at 95% confidence level (U), and number of analyses (n). Preferred value data are from Jochum et al. (2006).
File No101ЁЇvol.127, no. 2
ЯРРтЁЇНЉХФИЉНаБЉЛГУЯЄЮКћПЙЕжЮЭЄЫЪЌЩлЄЙЄыПЗТшЛАЗЯЄЮУЯМСЄШЗОСє ВНРаСиНј
ВУЦЃЭЊМЄЁІЬјТєЙЌЩз
ЁЪvol.127, no.2, p.105-120ЁЫ
- Figs. A1–A4. Maps showing the location of samples.
- Figs. A5, A6. Route maps of the stratigraphic sections Ra and Ma.
- Figs. A7–A10. Age vs thickness plots of selected stratigraphic sections.
- Figs. A11–A15. Light photomicrographs of diatoms.
- Table A1-A18.
ЁЁЁЁЁЁTables A2–A18. Occurrence charts of diatoms from stratigraphic sections A–Z.
File No100ЁЇvol.127, no. 1
ЅьЅПЁМЁЇРжРаЛГУЯУцБћЩєЄЮОЎНТРюУЯАшЄЫЪЌЩлЄЙЄыЮІИЛКеЖ§ДфЄЋЄщЦРЄщЄьЄПСАДќЧђАЁЕЊ КЧЫіДќЄЮКеЖ§РЅИЅыЅГЅѓ
ЛжТМавЮМЁІУцТМВТЧюЁІОяШзХЏЬщЁІПљЫмТчЛжЁІПхИЭСЯЬщ
ЁЪvol.127, no.1, p.51-58ЁЫ
- Appendix 1. Cathodoluminescence images of concordant zircon grains from samples 17112505 (a–d), OS2-30 (e–i), and 17112502 (j–m). Scale bars are 20 μm. Circles show the locations of analytical spots. Ages of detrital zircons ≤ 1200 Ma and >1200 Ma are 238U–206Pb and 207Pb/206Pb ages, respectively, in Ma. Age uncertainties are given at the 1 σ level.
- Appendix 2. Analytical operating conditions for LA-ICPMS U–Pb isotopic dating. Appendix 3. LA-ICP-MS U–Pb isotopic data. Discordant data are shaded gray.
File No99ЁЇvol.127, no. 1
ЯРРтЁЇЅеЅЃЅУЅЗЅчЅѓЁІЅШЅщЅУЅЏЧЎЧЏТхВђРЯЄЊЄшЄгU–Pb ЧЏТхТЌФъЄЫД№ЄХЄЄЄПЦюЖх НЃЄЛЄѓУЧТгЄЫЪЌЩлЄЙЄыЧЫКеТгЄЮГшЦАЛўДќ
ЫіВЌЁЁЬаЁІХчХФЙЬЛЫЁІОШТєНЈЛЪЁІДфЬюБбМљЁІУЩИЖЁЁХАЁІОЎЫЬЙЏЙАЁІЪПХФГйЛЫ
ЁЪvol.127, no.1, p.25-39ЁЫ
File No98ЁЇvol.127, no. 1
ЯРРтЁЇШЌШЈЩЭТчХчЄЫЪЌЩлЄЙЄыТчХчЪбРЎДфТЮЄЮЅИЅыЅГЅѓU–Pb ЧЏТхЄШУЯТЮЙНТЄОхЄЮАеЕС
ОЎЛГЦтЙЏПЭЁІЫЬЬюАьЪПЁІУцЬюПЩЇЁІТЮЉУЃЯЏЁІЪЦТМЯТЙЩЁІЕШЫмЁЁЬцЁІЕмВМЭГЙсЮЄЁІЪЦУюЁЁСяЁІОЎООРЕЙЌ
ЁЪvol.127, no.1, p.1-24ЁЫ
File No97ЁЇvol.126, no. 11
ЪѓЙ№ЁЇАІУЮИЉРпГкУЯАшХьЩєЄЮДгЦўДфТЮЄЮСДДфВНГиСШРЎЁЄЕБХйЄЊЄшЄгЪбМСХй
ПоЛвХФЯТХЕЁІВЌТМТРЯЉЁІЦѓТМЙЏЪПЁІТЋХФЯТЙАЁІУнЦтЁЁРП
ЁЪvol.126, no.11, p.645-654ЁЫ
- Appendixs 1-2
- Appendix 1. Photographs of polished surfaces of the samples versus distance from the samples Ft1, Sh1, and Tb1. Ft: Futto; Sh: Shimohara; Tb: Tochibata.
- Appendix 2. Whole-rock chemical composition of the trace lements in Futto and Tochibata samples.
File No96ЁЇvol.126, no. 11
ЅьЅПЁМЁЇЕЊАЫШОХчРОЩєЁЄЯТРєСиЗВКЧОхЩєЄЋЄщЄЮИХТшЛАЗЯЄЮШЏИЋ
АыљѕЙдЭКЁІФЙУЋРюЁЁЮЫЁІБзХФРВЗУЁІФщЁЁЧЗЖГ ЁЪvol.126, no.11, p.639-644ЁЫ
- Appendix 1. Methods for zircon separation and U–Pb dating.ЅИЅыЅГЅѓЪЌЮЅЄЊЄшЄгU–Pb ЧЏТхТЌФъМъЫЁЄЮРтЬРЁЅ
- Appendix 2. Example Cathodo-luminescence images of detrital zircons with oscillatory zoning (from Sample KRH) . ЅЊЅЗЅщЅШЅъЁМЮпТгЙНТЄЄђЛ§ЄФКеЖ§РЅИЅыЅГЅѓЄЮCLСќЄЮЮуЁЪЛюЮСKRHЁЫЁЅ
- Appendix 3. U–Pb age. U–Pb ЧЏТхЁЅЁЪTable A1. Sample KRHЁЅЛюЮСKRHЁЅ/Table A2. Sample MJKЁЅЛюЮСMJKЁЅ/Table A3. Sample SGDЁЅЛюЮСSGDЁЅ/Table A4. Sample NTKЁЅЛюЮСNTKЁЅ/Table A5. Sample TKO2ЁЅЛюЮСTKO2ЁЅ/Table A6. Sample SB1ЁЅЛюЮСSB1ЁЅ/Table A7. Sample SB2ЁЅЛюЮСSB2ЁЅ/Table A8. Sample CCOЁЅЛюЮСCCOЁЅ/Table A9. Sample SBRЁЅЛюЮСSBRЁЅЁЫTable A10. Summary of the youngest age clusters for dated zircons in the nine sandstone samples (n = number of grains). КНДфЃЙЛюЮСУцЄЮЅИЅыЅГЅѓЄЌЛ§ЄФКЧМуЧЏТхНИУФЄЮЄоЄШЄс (n ЄЯЮГЛвПє).
- Appendix 4. Tera-Wasserburg diagrams of U–Pb ages for zircons from all nine sandstone samples. КНДфЃЙЛюЮСУцЄЮЅИЅыЅГЅѓU–Pb ЧЏТхЄЮЅГЅѓЅГЁМЅЧЅЃЅЂПоЁЅ
- Appendix 5. Measurements of secondary standard sample (OD-3). ЦѓМЁЩИНрЛюЮСЁЪOD-3ЁЫЄЮТЌФъУЭЁЅ
File No95ЁЇvol.126, no. 11
ЅьЅПЁМЁЇХЗС№ВМХчЫЬЩєЄЮУцПЗРЄДгЦўДфТЮЄЮЪ§ИўЄШБўЮЯВђРЯ
ЕэДнЗђТРЯКЁІЛГЯЉЁЁЦи
ЁЪvol.126, no.11, p.631-638ЁЫ
- Appendix 1. Locations and orientation data (dip direction and dip) for sheet intrusions and bedding.
File No94ЁЇvol.126, no. 10
ЅьЅПЁМЁЇЫЬГЄЦЛПРЕяИХпЌЪбРЎДфЮрШЩЗЬЫкЦтЅцЅЫЅУЅШЄЋЄщЄЮПЗЄПЄЪЅИЅыЅГЅѓU–PbЧЏТх
ФЙХФНМЙАЁІТчЦЃЁЁЬа
ЁЪvol.126, no.10, p.597-601ЁЫ
- Fig. A1, Tables A1-A2
- Fig. A1. a) Photomicrograph (cross-polarized light; scale bar is 300 μm) of sample PKP2 (pelitic schist). Abbreviations Chl: chlorite, Ms: muscovite, Q-A: quartz and albite. b) Cathodoluminescence (CL) images of zircon grains from sample PKP2 with 206Pb/238U ages. Yellow open circles show measurement spots (25 μm). Scale bar is 50 μm. c) Concordia diagram of sample PKP2. Red solid and blue open circles denote concordant and discordant grains, respectively. Abbreviations N: number of concordant and discordant zircon grain. d) Probability density plot of all data (bin width is 50 million year). Abbreviations n: number of concordant zircon grain, YSG: youngest single grain 206Pb/238U age.
- Table A1. LA-ICPMS analytical conditions for U–Pb dating based on Kouchi et al. (2015).
- Table A2. The U–Pb zircon data for secondary standard zircons (91500 and OD-3) and sample PKP2. 206Pbc: common 206Pb (%). R: Rejected data, C (D):Concordant (discordant) data.ЁЅ
File No93ЁЇvol.126, no. 10
ЯРРтЁЇХьЕўХдЛКИХРИТхСАДќТЄЛГТгЄЮУЧЪвЁЇДиХьЛГУЯХьЩєЁЄ ЙѕРЅРюТгЙтАЕЗПЪбШУЄьЄЄДфЄЊЄшЄгВжжОДфЮрЄЮЅИЅыЅГЅѓU–Pb ЧЏТх
ТєХФЁЁЕБЁІАыљѕЙдЭКЁІКфХФМўЪП
ЁЪvol.126, no.10, p.551-561ЁЫ
- Open Online Table 1. Analytical results of zircon U–Pb dating by LA-ICP-MS. Values for f206 indicate the fractional amount of common Pb and those of Conc. indicate concordance between 207Pb/235U and 206Pb/238U ages (%). LA–ICPMS ЄЫЄшЄыЅИЅыЅГЅѓU–Pb ЧЏТхТЌФъЄЮЗыВЬЁЅf206ЄЯТЌФъЄЕЄьЄП206Pb ЄЮЄІЄСЄЮЅГЅтЅѓБєЄЮГфЙчЄђМЈЄЗЁЄConc. ЄЯ 207Pb/235U ЧЏТхЄШ206Pb/238U ЧЏТхЄЮАьУзЮЈЄђМЈЄЙЁЅ
File No92ЁЇvol.126, no. 9
ЯРРтЁЇС№ФХЧђКЌВаЛГЁЄЫмЧђКЌВаКеЕжЗВЄЮУЯМСЄШЗСРЎЛЫ
РаКъТйУЫЁІТљРюЁЁЖЧЁІЕЕУЋПЛвЁІЕШЫмНМЙЈЁІЛћХФЖЧЩЇ
ЁЪvol.126, no.9, p.473-491ЁЫ
- Appendix 1-2(PDF)
- Appendix 1. Sampling locations for whole-rock chemical analyses. Numbers in parentheses correspond to outcrop numbers in Figures 2 and 3.
- Appendix 2. Whole-rock chemical and modal compositions of the eruption products of the Motoshirane Pyroclastic Cone Group. Sampling locations are shown in Appendix 1. Modal compositions were determined by pointcounting to a total of ~2000 point for each sample. Phenocrysts were defined as those measuring >0.2 mm along their longest axis. Total Fe is expressed as Fe2O3. Loss on ignition (LOI) was measured by igniting the powdered samples at 900°C for 2 h. Abbreviations: Dw = densely welded lava-like section; JB = jointed block; SC = scoria; BB = breadcrust bomb; tr = present in samples but not observed in point counts; nd = not detected.
File No91ЁЇvol.126, no. 9
ЯРРтЁЇМЏЛљХчЯбБќЁЄПЗХчЄЫЯЊНаЄЙ ЄыКЧОхЩєЙЙПЗХ§ЁСДАПЗХ§ЄЮСиНјЄШЕЏИЛ
МЏЬюЯТЩЇЁІЬјТєЙЌЩзЁІЦтТМИјТчЁІБќЬюЁЁНМЁІУцТМНгЩз
ЁЪvol.126, no.9, p.519-535ЁЫ
- Figs. S1-S4, Tables S1-S4
- Table S1. Occurrence chart of diatoms in the uppermost Pleistocene to Holocene sediments exposed on Shinjima Island.
- Table S2. List of molluscan fossils collected from the Moeshima Shell Bed, Location 1, and from the Lower Shinjima Silt Bed, Location 3.
- Table S3. Refractive indices of constituent minerals in the Southern Shinjima Pumice, Shinjima Pumice, and Sakurajima– Satsuma tephra Sz-14.
- Table S4. Bulk chemical compositions of pumice samples collected from the Moeshima Shell Bed and from the Sz- 12 (S-BP) and Sz-13 (S-AP) tephras at Location 1.
- Fig. S1. Comparison of previous stratigraphy with the proposed divisions.
- Fig. S2. Photomicrographs of diatom slides. Scale bar = 50 μm. A = Assemblage F (Sample 12050402, Shinjima Pumice, Location 2); B = Assemblage F (Sample SJ12-01, Shinjima Pumice, Location 4); C = Assemblage F (Sample 15012009, Southern Shnjima Pumice, Location 1); D = Assemblage FM (Sample 12071607, Sz-13 tephra, Location 1); E = Assemblage M (Sample 12070401-1, Upper Shinjima Silt Bed, Location 1); F = Assemblage M (Sampleple 12050411, Lower Shinjima Silt Bed, Location 4). Assemblage F = Freshwater diatom assemblage with very rare marine diatoms, Assemblage FM = Mixed assemblage of freshwater and marine diatoms. Assemblage M = Marine diatom assemblage with rare brackish to freshwater diatoms.
- Fig. S3. (A) Photograph taken on August 20, 2013 showing the succession from the Shinjima Pumice to the Moeshima Shell Bed exposed at Location 4. The gravelly tuffaceous deposit is ~2.8 m thick. This outcrop is almost completely covered by vegetation. (B) Photograph taken in 1975, showing a normal fault displacing the exposed succession at the same location. Photograph courtesy of Kimihiko Oki.
- Fig. S4. Photohraph taken on January 21, 1994, showing the succession from the Southern Shinjima Pumice to the Moeshima Shell Bed, exposed at Location 1. The gravelly tuffaceous deposit is ~1.8 m thick. This large outcrop is covered by an embankment, talus, and thick vegetation.
- Fig. S5. Harker diagrams for the pumices from the Moeshima Shell Bed and the Sz-12 (S-BP) and Sz-13 (SAP) tephras. Numbers 1–8 correspond to the last digit of the sample numbers shown in Table S4. The major element compositions of Sz-5, 7, 8, 9, 10, and 11 and those of Sz-14 are adopted from Takahashi et al. (2011) and Yamamoto et al. (2013).
File No90ЁЇvol.126, no. 5
ЯРРтЁЇЖхНЃЫЬЩєЪЁВЌИЉУоЫУКХФЄЮЛЯПЗХ§ФОЪ§СиЗВВМЩєЄЮЅИЅыЅГЅѓU–Pb ЧЏТх
ЕмХФЯТМўЁІФЙХФНМЙАЁІПЮЬкСЯТРЁІЩўЩєЗђТРЯКЁІТчЮгНЈЙдЁІЪПХФГйЛЫЁІТчЦЃЁЁЬа
ЁЪvol.126, no.5, p.251-266ЁЫ
- Appendix 1. Photomicrographs of the tuff and tuffaceous rocks (a–d) of the Sanjakugoshaku Formation in plane-polarized (left) and cross-polarized light (right). (a), SARUTA, a tuffaceous mudstone including numerous glass shards; (b), HONDA, a laminated tuffaceous mudstone; (c), MIYAWAKA, a vitric tuff; (d), EBITSU, a vitric tuff including rhyolitic volcanic fragments. Abbreviations: Pl = plagioclase; Qtz = quartz; V = volcanic fragment.
- Appendix 2. Cathodoluminescence images of the selected zircon grains from the tuff and tuffaceous rocks of the Sanjakugoshaku Formation and 238U–206Pb ages. The circles indicate the spots analyzed via LA-ICPMS.
- Appendix 3. Analytical settings and standard materials for U–Pb zircon dating.
Appendix 4. U–Pb zircon data of the tuff and tuffaceous samples from the Sanjakugoshaku Formation, Nogata Group, and standard zircon in this study. Abbreviations: C = concordant grain; D = discordant grain.
File No89ЁЇvol.126, no. 5
ЪѓЙ№ЁЇПЗГуИЉЄЫЪЌЩлЄЙЄы7 ЫчЄЮТшЛЭЕЊЅЦЅеЅщЄЮLA-ICP-MS ЄЫЄшЄыЅИЅыЅГЅѓU–Pb ЧЏТх
АЫЦЃЕзЩвЁІТМООЩвЭК
ЁЪvol.126, no.5, p.285-290ЁЫ
- Fig. A1. Locations and outcrop photographs for sampled tephras. a) HK10, b) Odaira, c) Og, d) Yokokura, e) Kimigaeri,
f) Oguriyama, g) Shimizu Pass. Topographic maps are from the Geospatial Information Authority of Japan. - Table A1. LA-ICP-MS zircon U–Pb analytical results for the Niigata tephras. Data in italics (>75% common Pb contamination or >2 Ma) were excluded for further U–Pb analyses.
File No88ЁЇvol.126, no. 4
ЯРРтЁЇКыЖЬИЉВУМЃЕжЮЭЄЫЪЌЩлЄЙЄыВМЩєЙЙПЗХ§ЪЉЛвСиЄЮСиНјЄШЧЏТхЄЮКЦИЁЦЄ
ЧМУЋЭЇЕЌЁІПхЬюРЖНЈ
ЁЪvol.126, no.4, p.183–204ЁЫ
- Appendix 1.Occurrence of diatoms in the Bushi Formation.
- Appendix 2.List of typical tephras and chemical compositions of volcanic glass shards with low TiO2–MgO and high K2O contents in Lower Pleistocene deposits, central Japan.
File No87ЁЇvol.126, no. 4
ЪѓЙ№ЁЇЕЊАЫШОХчУцБћЩєЄЫЪЌЩлЄЙЄыЛЭЫќННТгЧђАЁЗЯХьРюЅГЅѓЅзЅьЅУЅЏЅЙЄЋЄщЦРЄщЄьЄПКеЖ§РЅИЅыЅГЅѓU–Pb ЧЏТх
ЛжТМавЮМЄлЄЋ
ЁЪvol.126, no.4, p.223–230ЁЫ
- Appendix 1.LA-ICP-MS U–Pb isotopic data. Discordant data are shown in gray color. 206Pbc: common 206Pb (%).
File No86ЁЇvol.126, no. 3
ЪѓЙ№ЁЇС№ФХЧђКЌВаЛГЁЄЧђКЌВаКеЕжЗВЁЄЕнУгЅоЁМЅыЄЊЄшЄгАЉЅЮЪіВаКеЕжЄЮДфРаГиХЊЦУФЇ
ЕЕУЋПЛвЄлЄЋ
ЁЪvol.126, no.3, p.157-165ЁЫ
- Appendix 1. Whole-rock compositions and modal compositions. Total Fe expressed as Fe2O3. For plotting on Harker diagrams (Fig. 5), FeO* was calculated as FeO + (0.8998×Fe2O3). Mineral and groundmass (glass + microphenocryst + microlite) abundances are in vol% (calculated on a vesicle-free basis) based on >2000 point counts. Loss on ignition (LOI) was measured by igniting the powdered samples at 900°C for 2 h. Abbreviations: Vol. Bl.: volcanic block; tr: present in samples but not observed in point counts; n.d.: not detected.
File No85ЁЇvol.126, no. 3
ЯРРтЁЇЩйЛЮЛГХьЪ§ЄЧ1.1kaЄЫШЏРИЄЗЄПТчЕЌЬЯВаЛГРМаЬЬЪјВѕ
ЛГИЕЙЇЙЄлЄЋ
ЁЪvol.126, no.3, p.127-136ЁЫ
- Supplement 1.Results of major elements composition analysis for volcanic glasses by Energy Dispersive X-ray Spectrometry. 161212c Ёс Kozushima-Tenjyosan tephra. OYM-03-01, g-sample and g1-1 Ёс volcanic glass shards in OYM03. ЅЈЅЭЅыЅЎЁМЪЌЛЖЗПЅЈЅУЅЏЅЙРўЪЌРЯЄЫЄшЄыВаЛГЅЌЅщЅЙЄЮМчРЎЪЌ СШРЎТЌФъЗыВЬЁЅ161212c ЁсПРФХХчХЗОхЛГЅЦЅеЅщЁЅOYM-03- 1, g-sample ЕкЄгg1-1 Ёс OYM03 УцЄЮВаЛГЅЌЅщ
File No84ЁЇvol.126, no. 3
ЯРРтЁЇЛАНХИЉЛжЫрШОХчЄЮЙѕРЅРюТгМиЬцДфУцЅЩЅьЅщЅЄЅШДфВєЄЮУЯЕхВНГиЄШЕЏИЛ
ЦтЬюЮДЧЗ
ЁЪvol.126, no.3, p.113-125ЁЫ
- Appendix Table. Whole-rock major- and trace-element geochemical data for standard samples (certified reference materials). “Measured” indicates values analyzed in this study, and“ certified” indicates known certified values
File No83ЁЇvol.125, no. 11
ЪѓЙ№ЁЇРжРаЛГУЯУцБћЩєЄЫЪЌЩлЄЙЄыУсЩуТгЩеВУТЮЄЮКеЖ§РЅИЅыЅГЅѓU–Pb ЧЏТх
ПљЫмТчЛжЄлЄЋ
ЁЪvol.125, no.11, p.827-832ЁЫ
- Appendix 1-5. LA-ICP-MS U–Pb isotopic data. Analyses shown in italics are discordant data. All errors are quoted as 1σ.
File No82ЁЇvol.125, no. 11
ЯРРтЁЇЩйЛГИЉЄЫЪЌЩлЄЙЄыТРШўЛГСиЗВЄЮЅИЅыЅГЅѓU–PbЧЏТх
ЖтЛвАьЩзЄлЄЋ
ЁЪvol.125, no.11, p.781-792ЁЫ
- Appendix. U–Pb isotopic data of the unknown zircon samples and zircon standards (Nancy 91500 and OD- 3). (C) concordant data set; (D) discordant data set; (IC) data from a spot containing an inclusion or a crack; (R) data from a spot containing resin or data from a zircon grain that detached from the resin during laser ablation. Data shown in italics (D, IC, and R in the column labelled “Remarks”) were rejected before calculation of isotopic ages
File No81ЁЇvol.125, no. 9
ЅЮЁМЅШЁЇДЧШФЁІПЗЪЙРоЄъЙўЄпЙЙ№ЄШЖЕВЪНёЄЫЄЊЄБЄыУЯПоЄЮЫЬЄђЩНЄЙЕЙцЄЮЛШЭбЄШТчГиРИЄЮЭ§Вђ
зЂЬкЕСЕз
ЁЪvol.125, no.9, p.699-705ЁЫ
File No80ЁЇvol.125, no. 9
ЯРРтЁЇExcel ЄЮЅНЅыЅаЁМЕЁЧНЄђЭјЭбЄЗЄПЧЎЮЯГиЗзЛЛЪ§ЫЁЁЇНХПДКТЩИЗЯЄЮВНГиМАЄђЭбЄЄЄПЧЎЮЯГиЗзЛЛЄиЄЮХЌЭбЮу
ЕзХФИјАь
ЁЪvol.125, no.9, p.635-654ЁЫ
File No79ЁЇvol.125, no. 7
ЯРРтЁЇЩйЛГИЉШЌШјУЯАшЄЮПЗРИГІЧЏТхСиНјЄЮКЦИЁЦЄЄШЅЦЅЏЅШЅЫЅЏЅЙ
УцХшЁЁЗђЁІДфЬюБбМљЁІУЩИЖЁЁХАЁІЛГВМЁЁЦЉЁІЬјТєЙЌЩзЁІУЋТМЙЅЭЮЁІХЯЪеПППЭЁІКДЯЦЕЎЙЌЁІУцРОЁЁЩвЁІЛАРаЭЕЧЗЁІЛГВЪЕЏЙдЁІКЃЫйРПАь
ЁЪvol.125, no.7, p.483-516ЁЫ
File No78ЁЇvol.125, no. 6
ЪѓЙ№ЁЇШє驒ЛГУЯВУВьТєЄЮВжжОДфЮрЄЮЅИЅыЅГЅѓU–Pb ЧЏТх
УнЦт РПЁІМЦХФ ИЁІЅЋ ЅЙЅЄЁІЛГЫмЙнЛж
ЁЪvol.125, no.6, p.453-459ЁЫ
- Appendix 1. U–Pb isotopic data for zircons analyzed in this study. All errors are 2σ. Analyses shown with shading are discordant and are not included in the probability density plots and histograms.
File No77ЁЇvol.125, no. 6
ЪѓЙ№ЁЇАІЩВИЉЕзЫќЙтИЖФЎЄЮЛАЧШРюЪбРЎДфЮрУцЄЫПЗЄПЄЫИЋЄФЄЋЄУЄП“СЦЮГЄЪ”ЪбБіД№РДфТЮ
УчХФИїЕБЁІЦяЖЖ ФОЁІѓюЦЃ ХЏЁІТчЦЃЙАЬРЁІЦрЮЩРЕЯТ
ЁЪvol.125, no.6, p.447-452ЁЫ
- AFig. S1-Table S2
- Fig. S1. Geological route map around the outcrops of the metabasite body. The location of this area is shown in Fig. 1.
- Fig. S2. Rock sections. (a–d) Color images of (a–d) of Fig.3. (e–i) Metabasite clasts sampled from the basal conglomerate of the Hiwadatoge Formation unconformably overlying the metabasite at outcrop NMMGB003.(j) Metabasite clast sampled from the basal conglomerate of the Hiwadatoge Formation exposed at Nakajo. The location of the outcrop is indicated by the white star (B) in Fig. 1. The scale bars equal 1 cm.
- Fig. S3. Photomicrographs of a metabasite sample collected at outcrop NM-MGB002 under (a, c, e, g) plane-polarized light and (b, d, f, h) cross-polarized light. (a, b) Color images of (a, b) of Fig. 4. The scale bars for (a,b), (c, d) and (e, f) equal 1 mm, and that for (g, h) equals 0.5 mm. Abbreviations: Act, actinolite; Al, albite; Mtx, matrix; Ppc, “ porphyroclast”; Ttn, titanite, Zo, zoisite.
- Table S1. SEM-EDS data (wt%) for minerals within the metabasite samples collected from outcrop NMMGB002 and the basal conglomerate of the Hiwadatoge Formation (outcrop NM-MGB003; samples NM-HTFg116 and 310). Abbreviations: Chl, chlorite; Phn, phengite; Ttn, titanite.“ –” indicates below the detection limit.
- Table S2. Whole rock chemical composition (wt%) for the metabasite samples collected from outcrop NMMGB002 and the basal conglomerate of the Hiwadatoge Formation (outcrop NM-MGB003; samples NM-HTFg099 and 100) quantified by XRF.
File No76ЁЇvol.125, no. 6
ЯРРтЁЇЫЬЩєЖхНЃЧђАЁЕЊВжжОДфЮрЁЄХКХФВжжОСЎЮаДфЄЮU–Pb ЅИЅыЅГЅѓЧЏТхЄШSrЁІNd ЦБАЬТЮШцСШРЎЁЇХКХФВжжОСЎЮаДфЄЮКЦЖшЪЌ
ЭЎИЖВэМљЁІЕЕАцНпЛжЁІРюЬюЮЩПЎЁІВЌЬю НЄЁІСсКфЙЏЮДЁІВУЁЙШўДВЭК
ЁЪvol.125, no.6, p.405–420ЁЫ
- Appendix 1. Whole-rock chemical compositions of the hornblende porphyritic facies of the Irahara Granodiorite.
File No75ЁЇvol.125, no. 5
ЯРРтЁЇЕЊАЫШОХчУцБћЩєЄЫЪЌЩлЄЙЄыЅИЅхЅщЕЊУсЩуЩеВУТЮЄШЧђАЁЕЊЛЭЫќННЩеВУТЮЄЮЖГІМўЪеЄЮУЯМСЙНТЄЄШ КеЖ§РЅИЅыЅГЅѓU–Pb ЧЏТх
ЛжТМавЮМЁІОяШзХЏЬщЁІУнЦтЁЁРПЁІЛГЫмЙнЛж
ЁЪvol.125, no.5, p.349-365ЁЫ
- Appendix 1. LA-ICP-MS U–Pb isotopic data. Rejected data are shown in gray color. 206Pbc: common 206Pb (%).
File No74ЁЇvol.125, no. 5
ЯРРтЁЇЕЊАЫШОХчУцБћЩєЙтИЖРюУЯАшЄЮЧђАЁЕЊЩеВУЅГЅѓЅзЅьЅУЅЏЅЙЄЮКеЖ§РЅИЅыЅГЅѓU–Pb ЧЏТх
ТРХФЬРЮЄЁІУнЦтЁЁРПЁІЅЪЅЩЅпЅЩ ЅаЅфЅыЅШЁІЛГЫмЙнЛж
ЁЪvol.125, no.5, p.329-347ЁЫ
- Appendix 1. U–Pb isotopic data of zircons analyzed in this study. All errors are 2σ. Analyses shown with a shadow are discordant and are not included in the probability density plots and histograms.
File No73ЁЇvol.125, no. 4
ЯРРтЁЇДєЩьИЉЙтЛГЛдЫмЖПУЯАшЄЫЄЊЄБЄыШєТЭГАБяТгЄЮКеЖ§ДфСиЄЋЄщЦРЄщЄьЄПКеЖ§РЅИЅыЅГЅѓЄЮU–Pb ЧЏТхЄШЄНЄЮАеЕСЁЇ ПЙЩєСиЄЊЄшЄгЅИЅхЅщЗЯЦВХТСиЁЪПЗОЮЁЫЄЮТЯРбЧЏТх
ЮыЬкЗЩВ№ЁІЗЊИЖЩвЧЗЁІПЂХФЭІПЭ
ЁЪvol.125, no.4, p.307-322ЁЫ
- Supplementary Figure 1. Map showing the location of sandstone samples selected for petrographic analyses and U–Pb detrital zircon dating (except for sample 0609-03) in the Hongo area.
- Supplementary Table 1. U–Pb zircon dating results. Abbreviations:Ra = age ratio; σc = concordance error; SE =standard error.
- Supplementary Table 2. Results of U–Pb zircon dating on the Plešovice standard. Abbreviations: Ra = age ratio;σc = concordance error; SE = standard error.
File No72ЁЇvol.125, no. 4
ЯРРтЁЇНаБЉЛГУЯХьБяЁЄНЉХФИЉГбДлФЎМўЪеЄЮОхЩєСВПЗХ§ЄЊЄшЄгУцПЗХ§ЄЮСиНј
КйАцЁЁНпЁІЙЉЦЃЁЁПђЁІБЉУЯНгМљЁІДфЬюБбМљЁІУЩИЖЁЁХАЁІЪПХФГйЛЫ
ЁЪvol.125, no.4, p.279-295ЁЫ
File No71ЁЇvol.125, no. 2
ЪѓЙ№ЁЇЦќЙтЪбРЎТгЦюЩєЁЄВЋЖтЦЛЯЉБшЄЄЄЫЯЊНаЄЙЄыЄЋЄѓЄщЄѓРаЅЮЁМЅщЅЄЅШЄЮДфРаГиХЊЦУФЇ
ЛжТМНгОМЁІОЎХч ЫЈЁІТчЖЖШўЭГДѕЁІЛГКЌДДРИЁІAnthony I. S. Kemp
ЁЪvol.125, no.2, p.195-200ЁЫ
- Table A1. Whole rock chemical compositions and, Sr and Nd isotope ratios of the olivine norite.
File No70ЁЇvol.125, no. 2
ЯРРтЁЇU–Pb zircon dating of the Sanbagawa metamorphic rocks in the Besshi–Asemi-gawa region, central Shikoku, Japan, and tectonostratigraphic consequences.
Aoki, K., Seo, Y., Sakata, S., Obayashi, H., Tsuchiya, Y., Imayama, T., Yamamoto, S. and Hirata, T
ЁЪvol.125, no.2, p.183–194ЁЫ
- Table A1. LA-ICP-MS U–Pb concordia data from zircon analyses.
File No69ЁЇvol.125, no. 2
ЯРРтЁЇЛГИ§ИЉХьЩєЁЂЬјАцУЯАшЄЫЛКЄЙЄыЮЮВШТгГїЬюВжжОСЎЮаДфЄЮЅоЅАЅоВсФјЁЅ
УгХФЭКЕБЁІТчЯТХФРЕЬРЁІРОФЭ ТчЁІЕЕАцНпЛж
ЁЪvol. 125ЁЄno. 2, 167–182ЁЫ
- Table A1-A4
- Table A1. Representative chemical compositions of garnet. FeOT: total Fe. Alm=100*Fe/(Fe+Mn+Mg+Ca), Sps=100*Mn/(Fe+Mn+Mg+Ca), Pyr=100*Mg/(Fe+Mn+Mg+Ca), Grs=100*Ca/(Fe+Mn+Mg+Ca).
- Table A2. Representative chemical compositions of plagioclase. FeOT: total Fe. An=100*Ca/(Ca+Na+K), Ab=100*Na/(Ca+Na+K), Or=100*K/(Ca+Na+K). Positions from A to A’ correspond to the analytical points shown in Fig. 7.
- Table A3. Representative chemical composition of biotite. FeOT: total Fe. Mg# = 100*Mg/(Fe+Mg).
- Table A4. Representative chemical composition of hornblende. FeOT: total Fe. Mg# = 100*Mg/(Fe+Mg).
File No68ЁЇvol.125, no. 1
ЯРРтЁЇЫМСэШОХчЄЫЪЌЩлЄЙЄыОхСэ СиЗВЄЮЙАшЅЦЅеЅщЁнЦУЄЫОхСэСиЗВВМЩєЄЫЄЊЄБЄыЅЦЅеЅщСиНјЄШПЗЄПЄЪТаШцЁн
ХФТМЛхЛвЁІПхЬюРЖНЈЁІБЇХдЕмРЕЛжЁІУцХшЕБАєЁІЛГКъРВЭК
ЁЪvol.125, no.1, p.23-39ЁЫ
- Open File(PDF): Sampling locality maps based on the 1:25,000 topographic maps “Onjuku” (a–d), “Kazusa-Ohara” (e), and “Katsuura” (f and g) of the Geographical Survey Institute, Japan.
File No67ЁЇvol.124, no. 12
ЪѓЙ№ЁЇGeochemical database of Japanese islands for basement rocks: compilation of domestic article
Satoru Haraguchi, Kenta Ueki, Kenta Yoshida, Tatsu Kuwatani, Mika Mohamed, Shunsuke Horiuchi and Hikaru Iwamori
ЁЪvol.124, no.12, p.1049-1054ЁЫ
- ppendix A (pdf). Articles compiled in the DODAI until the end of 2017.
- Appendix Table 1 (pdf). Characteristics of worldwide databases, some domestic databases, and the DODAI. (The numbers of references and samples were compiled from EarthChem until the end of 2017).
- Appendix Table 2 (csv). Compiling geochemical data of DODAI.
File No66ЁЇvol.124, no. 12
СэРтЁЇШўЧЛТгСиОѕЅСЅуЁМЅШЄЮТЯРбДѓЙЦЄЫДиЄЙЄы3ЄФЄЮЬфТъ
ШјОхХЏМЃЁЪvol.124, no.12, p.1021-1032ЁЫ
- PDF (1.9MB)
ЪфАфЁЇОхЩєЛАОіЗЯСиОѕЅСЅуЁМЅШЄЮМчЭзИЕСЧЪЌРЯЗыВЬЄЫЄФЄЄЄЦ - Fig. A1. Geologic and location maps of the study sections along the Kiso River, central Japan. Modified after Wakita (1988).
- Fig. A2. Field occurrence of Late Triassic bedded chert at Sakahogi in the Inuyama area in the Mino Belt, Japan. (a) lower Upper Norian (lower Sevatian; Epigondolella bidentata conodont zone) bedded chert. (b) upper Upper Norian (upper Sevatian; Misikella hernsteini conodont zone) bedded chert. Scale bars, 5 cm.
- Table A1. Major element data for samples from the Sakahogi section. Major element compositions of the Sakahogi chert and claystone samples normalized to 100 wt%.
- Table A2. Analytical results of major element in reference material (JCh-1) by XRF.
File No65ЁЇvol.124, no. 11
ЯРРтЁЇЛАНХИЉЄЫЪЌЩлЄЙЄыУцПЗХ§АьЛжСиЗВОхЩєЄЮЩтЭЗРЭЙІУюЁІЗОСєВНРаСиНј
ТчПЎХФЩЇЫсЁІЮгЁЁЙМљЁІЬјТєЙЌЩзЁІЗЊИЖЙдПЭЁІРБЁЁЧюЙЌ
ЁЪvol.124, no.11, p.919-933ЁЫ
- Appendix 1. Map showing sample localities. Base map is a topographic map downloaded from the Geospatial Information Authority of Japan (GSI; http://www.gsi.go.jp).
File No64ЁЇvol.124, no. 11
ЪѓЙ№ЁЇNew geochemical data for back-arc basin basalts from DSDP Leg 58 Sites 442–444 and the ODP Leg 131 Site 808, Shikoku Basin Keywords: Shikoku Basin, back-arc basin basalt, DSDP Leg 58 Site 442–444, ODP Leg 131 Site 808, recent analytical technique
Satoru Haraguchi, Koichiro Fujinaga, Kentaro Nakamura, Yasuhiro Kato, Asuka Yamaguchi, and Teruaki Ishii
ЁЪvol.124, no. 11, p.935-940ЁЫ
- Appendix A. Analytical Methods.
- Appendix Table 1. Bulk rock composition of samples estimated using XRF for DSDP Leg 58 Sites 442–444 and ODP Leg 131 Site 808.
- Appendix Table 2. Bulk rock composition of samples estimated using ICP-MS for DSDP Leg 58 Sites 442–444 and ODP Leg 131 Site 808.
File No63ЁЇvol.124, no. 10
ЯРРтЁЇЦЪЬкИЉЫЬЩєЁЄЪЁХчИЉЦюЩєЄЫЪЌЩлЄЙЄыУцДќЙЙПЗРЄВаКеЮЎТЯРбЪЊЗВЄЮСиНј
ЛГХФтУПѓЁІВЯЙчЕЎЧЗЁІРОпЗЪИОЁЁІЮыЬкЕЃЩЇ
ЁЪvol.124, no. 10ЁЄp.837-855ЁЫ
- Appendix. Major-element contents of volcanic glass shards obtained by EDS measurement.
File No62ЁЇvol.124, no. 10
ЯРРтЁЇДфМъИЉРОЯТВьФЎЄЫЪЌЩлЄЙЄыЅАЅъЁМЅѓЅПЅеЄЮЅИЅыЅГЅѓFT ЄЊЄшЄгU–Pb ЧЏТхЄШЄНЄЮАеЬЃ
КйАцЁЁНпЁІУцХшЁЁЗђЁІУЩИЖЁЁХАЁІДфЬюБбМљЁІЪПХФГйЛЫЁІХЗЬюАьУЫ
ЁЪvol.124, no. 10ЁЄp.819-835ЁЫ
File No61ЁЇvol.124, no. 9
ЯРРтЁЇЦќЫмГЄГШТчАЪЭшЄЮЦќЫмЮѓХчЄЮТЯРбЫпЅЦЅЏЅШЅЫЅЏЅЙ
УцХшЁЁЗђ
ЁЪvol.124, no. 9ЁЄp.693-722ЁЫ
- Fig. S1-S2(PDF)
- Fig. S1. Chronostratigraphic correlations, including inferred paleostress regimes and tectonic events, for the Hokuriku district and the Toyama Trough. The geomagnetic timescale is after ATNTS2012 (Gradstein et al., 2012). Diatom biostratigraphy is after Yanagisawa and Akiba (1998). The Intra Lower Teradomari Unconformity Horizon (ILTU) is after Muramoto et al. (2007).
- Fig. S2. Tectonostratigraphic and paleoenvironmental relationships in the Sea of Japan from the middle Miocene to the early Pliocene (compiled from: Hanagata et al., 2001; Japanese Association for Petroleum Technology, 2014; Nakajima, 2013; and Sato et al., 1991). The planktonic foraminifera zonation is from Blow (1969) and Maiya (1978), the benthic foraminifera zonation from Maiya (1978), and the nannofossil zonation from Martini (1971) and Sato et al. (1991). Abbreviations: F.O., First occurrence; L.O., Last occurrence; PFSS, Planktonic Foraminiferal Sharp Surface (after Maiya and Inoue, 1981).
File No60ЁЇvol.124, no. 7
ЯРРтЁЇРжРаЛГУЯЛЭЫќННТгЧђАЁЗЯРжРаСиЗВЄЋЄщЦРЄщЄьЄПКеЖ§РЅИЅыЅГЅѓU-PbЧЏТх
ОяШиХЏЬщЁІЛдУЋЯТЬщЁІЛжТМавЮМЁІУнЦтЁЁРПЁІЛГЫмЙнЛж
ЁЪvol.124, no. 7ЁЄp.539-544ЁЫ
- Appendix1-5 (PDF)
- Appendix 1-5. LA-ICP-MS U–Pb isotopic data. Analyses shown in italics are discordant data.
File No59ЁЇvol.124, no. 6
ЯРРтЁЇВаЛГЅЌЅщЅЙЄЮМчРЎЪЌЄЊЄшЄгШљЮЬИЕСЧСШРЎЄЫЄшЄыМЏЛљХчЛдБЪХФРюВЯИ§ЩєЄЧЗЁКя ЄЕЄьЄПЅмЁМЅъЅѓЅАЅГЅЂЄЫЖДЄоЄьЄыВаКеЮЎТЯРбЪЊЄЮМБЪЬ
ИХпЗЁЁЬРЁІТчЬкИјЩЇЁІЕмЯЦЭ§АьЯК
ЁЪvol.124, no. 6ЁЄp.435-447ЁЫ
- Appendix1(PDF 681KB)
- Appendix 1. Glass composition data for Aira-Tn tephra and ATHO-G of MPI-DING Reference Glasses. Av., average; SD, standard deviation; U, uncertainty at the 95% confidence level; n, number of analyses. Preferred values are from Jochum et al. [2006].
File No58ЁЇvol.124, no. 4
ЯРРтЁЇДфМъВаЛГЄЫЄЊЄБЄыКЧЖс1ЫќЧЏДжЄЮЧњШЏХЊЪЎВаЭњЮђЄЮКЦИЁЦЄЁЇПхОјЕЄЪЎВаЄШЅоЅАЅоЪЎВаЄЮЛўЖѕДжХЊДиЯЂ
АЫЦЃНчАьЁІпРКъСяЛжЁІРюЪеФїЕз
ЁЪvol.124, no. 4ЁЄp.271-296ЁЫ
- Appendix1-4(PDF 3.6MB)
- Appendix 1. XRD diagram.
- Appendix 2. XRD peak intensities (cps and relative ratio) for analyzed samples. Sm: smectite (peak position is 2θ = 5.4°), Pyr: pyrophyllite (2θ= 9.3°), Kln: kaoline minerals (2θ = 12.3°), Crs: cristobalite (2θ = 21.7°), Qtz: quartz (2θ = 26.6°), Na-Alu: natroalunite (2θ = 30.1°). Peak position and intensity were analyzed using Peak Search for indows (ver. 6.1, Rigaku Corporation).
- Appendix 3. Log(thickness) versus square root of isopach area for magmatic tephra and pyroclastic surge deposits, with best-fit lines through the data used to calculate the eruption volume. Isopach maps for Iw-W6 c and d, Iw-W6 a and b, Iw-W5, Iw-OdS, Iw-W2b-2, Iw-W2b-1, and Iw-OkS are shown in Fig. 9, and isopachs for Iw-W9, Iw-W8a, Iw-SuS, Iw-SuSr, Iw-KSr, and Iw-KS are from Doi (2000).
- Appendix 4. List of coefficient of the equation, obtained from linear fits to data using the thickness-dispersion area coordinates in Appendix 3. Eruption volumes for each tephra are calculated after Fierstein and Nathenson (1992). Pyroclastic surge deposits Iw-KSr and Iw-SuSr are plotted alongside (straight lines). A specific gravity of 1.0 is used for scoria fall deposits, 1.5 for fine ash and volcanic sand deposits, and 1.2 for ash and scoria. Eruption ages for each deposit are summarized in Table 4.
File No57ЁЇvol.124, no.2
ЯРРтЁЇ2014 ЧЏЄЮФЙЬюИЉПРОыУЧСиУЯПЬЄЮСАИхЄЫЄЊЄБЄыПЗГуИЉННЦќФЎЛдММЬюХЅВаЛГЄЮЭЯТИЅЌЅЙЧЛХйЄШУКСЧЦБАЬТЮШцЄЮЪбВН
ГСКъДюЙЈЁІЅЗЅхЅЪЅЄЅРЁМ ЅАЅьЅѓЁІУЊЖЖЁЁГиЁІРаХФФОПЭЁІООЫмЁЁЮЩ
ЁЪvol.124, no. 2ЁЄp.127-140ЁЫ
- Open File. 1(mp4 18.4MBЁЫ Video taken at the gas-venting crater of Murono mud volcano at ~03:00 PM, 22 November 2014 (~7 hours prior to the 2014 Kamishiro Fault Earthquake). This gasventing crater is also shown in Fig. 1D. This video was taken from the same locality as Open File 2.
- Open File 2(mp4, 24.8MB) Video taken at the gas-venting crater of Murono mud volcano at ~09:00 AM, 23 November 2014 (~11 hours following the earthquake).
File No56ЁЇvol.123, no.12
ЅЮЁМЅШЁЇСіККЗПX РўЪЌРЯИВШљЖРЄШВшСќНшЭ§ЁІВђРЯЅНЅеЅШЅІЅЇЅЂЄђЭбЄЄЄПЅтЁМЅЩТЌФъ
ПЂЬкУщРЕЁІУАБЉРЕЯТ
ЁЪvol.123, no. 12ЁЄp.1061-1066ЁЫ
Appendixs
- Appendix 1. Example of measurement conditions.
- Appendix 2. Original data from the element distribution image as measured with an X-ray microscope (XGT-5000).
- Appendix 3. Comparison with measured values obtained using the point-counting method.
File No55ЁЇvol.123, no.12
ЪѓЙ№ЁЇЪМИЫИЉЫЬЩєЁЄЛГБЂГЄДпЅИЅЊЅбЁМЅЏБюШјТьЩеЖсЄЮУцДќУцПЗРЄЅщЅГЅъЅЙ
БЉУЯНгМљЁІЛГЯЉЁЁЦи
ЁЪvol.123, no12ЁЄp.1049-1054ЁЫ
Figs & Tables
- Fig. A1. Photographs of the Saruodaki Falls. (a) Upper and lower parts of the falls. The rectangle indicates the location of the image in (b). (b) Horizontal sub-layers of the intrusive body, which are recognized by their fracture patterns.
- Fig. A2. Photomicrographs of mounted zircon grains from the Tsukuriyama Laccolith (top) and the 20 zircons analyzed for U–Pb dating (bottom).
- Table A1. LA-ICP-MS FT age data of zircons from the Tsukuriyama Laccolith sample.
- Table A2. LA-ICP-MS U–Pb age data of zircons from the Tsukuriyama Laccolith and a secondary standard (OD-3).
- Table A3. LA-ICP-MS FT age data of zircons from the Tsukuriyama Laccolith sample.
File No54ЁЇvol.123, no.12
ЯРРтЁЇЛАНХИЉЛжЫрШОХчЁЄУсЩуЮпТгЫЬТгЧђЬкСиЗВЄЮХЅДфЄЋЄщЦРЄщЄьЄПУцДќЅИЅхЅщЕЊЪќЛЖУюВНРаЄШУЯМСТаШц
ЦтЬюЮДЧЗЁІЮыЬкЕЊЕЃ
ЁЪvol.123, no12ЁЄp.1015-1033ЁЫ
Appendix
- Appendix. Route maps of the radiolarian fossil locations. (A) Location R1, Isobedani River, (B) Location R2, Tsuiji River, (C) Location R3, west of the Kamiji Dam, (D) Location R4, Gochi–Erihara forest road, (E) Locations R5 and R6, Gochi River. C: coherent facies, GATL: Gokasho–Arashima Tectonic Line, R.: river.
File No53ЁЇvol.123, no.11
ЯРРтЁЇЕЊАЫШОХчУцБћЩєЄЫЪЌЩлЄЙЄыЛЭЫќННТгЧђАЁЗЯЧўУЋСиЄЮУЯМСЄШКеЖ§РЅИЅыЅГЅѓU-PbЧЏТх
ЛжТМавЮМЁІОяШиХЏЬщЁІУнЦтЁЁРПЁІЛГЫмЙнЛж
ЁЪvol.123, no11ЁЄp.925-937ЁЫ
Appendix
- LA–ICP–MS U–Pb isotopic data. Rejected data are shown in gray color, not used in the analyses of the probability density plot and histogram. 206Pbc: common 206Pb.
File No52ЁЇvol.123, no.10
СэРтЁЇХчИЬ-ТчЮІУЯГЬПМЩєИНОнЄЮИІЕцПЪХИЁЇФЖЙтВЙЪбРЎКюЭбЄЮРКЬЉВђРЯ
ОЎЛГЦтЙЏПЭЁІУцЬюПЩЇЁІТЮЉУЃЯЏ
ЁЪvol.123, no10ЁЄp.879-906ЁЫ
Figs. S1-S4, Table S1
- Fig. S1. Distribution of the Napier Complex in the Enderby Land and geological map of the Tonagh Island (modified after Osanai et al., 1999a).
- Fig. S2. Distribution of the Highland Complex in Sri Lanka (modified after Osanai et al., 2016a).
- Fig. S3. Distribution of the metamorphic complexes in the Kontum Massif (modified after Osanai et al., 2008).
- Fig. S4. Geological map of the Higo metamorphic Belt (modified after Osanai et al., 2016a).
- Table S1. Publication list for article on UHT rocks written by Japanese research group.
File No51ЁЇvol.123, no.9
ЯРРтЁЇЅьЁМЅЖЁМЅЂЅжЅьЁМЅЗЅчЅѓICPМСЮЬЪЌРЯСѕУжЄђЭбЄЄЄПВаЛГЅЌЅщЅЙЄЮЪЌРЯЄЫЄшЄыННЯТХФЅЋЅыЅЧЅщЕЏИЛТчЩдЦАЅЦЅеЅщЄШШЌИЭЅЦЅеЅщЄЮМБЪЬ
ИХпЗЁЁЬР
ЁЪvol.123, no.9ЁЄp.765-776ЁЫ
Appendix 1.
Appendix 1. Analyttical result of AT tephra and ATHO-G glass shards for major element compositions using EDX and trace elemental concentration in AT tephra and ATHO-G glass shards determined by LA-ICP-MS. Av.: average, SD: standard deviation, U: uncertainty at 95% confidence level,n: number of an
File No50ЁЇvol.123, no.9
СэРтЁЇУЯМСВЙХйЗзАЕЮЯЗзЄЮКЧЖсЄЮПЪХИIЁЇЪбРЎВЙХйАЕЮЯЄЮПєУЭВђРЯ
РюжПУвЭЄ
ЁЪvol.123, no.9ЁЄp.699-706ЁЫ
Supplementary programme 1ЁЄ2ЁЄ3
Supplementary programme 1ЄЫИђХРЄШЄНЄЮИэКЙЄђЗзЛЛ ЄЙЄыFORTRAN77 ЅзЅэЅАЅщЅр“Intersection”ЄђКмЄЛЄПЁЅ Supplementary programme 2ЁЄ3 ЄЫКЧОЎ2 ОшЫЁЄђЭбЄЄЄП ЪбРЎВЙХйАЕЮЯЄШЄНЄЮИэКЙЁЄЧЄАеЄЮP–T ЖЪРўЄЮИђХРЄШЄНЄЮИэ КЙЁЄИђХРЄЮЪПЖбУЭЄШЄНЄЮИэКЙЄђЗзЛЛЄЙЄыFORTRAN77 Ѕз ЅэЅАЅщЅр“Weight-free P–T estimate”ЄШ“Weighted P–T estimate”ЄђЭПЄЈЄПЁЅ
File No49ЁЇvol.123, no.5
ЯРРтЁЇЅИЅыЅГЅѓU–Pb ЧЏТхЄЋЄщЄпЄПВМЩєЅИЅхЅщЗЯЭшЧЯСиЗВЄЮТЯРбЧЏТх
УнЦтЁЁРПЁІОяШзХЏЬщЁІЗЇКъФОМљЁІВЃХФНЈРВЁІЛГЫмЙнЛж
ЁЪvol.123, no.5ЁЄp.335-350ЁЫ
Appendix 1.
U–Pb isotope data for zircons analyzed in this study. All errors are 2s. %conc = 100Ѕ(238U–206Pb age)/(235U–207Pb age) is a measure of concordance between 238U–206Pb and 235U–207Pb ages. Shading indicates discordant data that are not included in the probability density plots or histograms.
File No48ЁЇvol.123, no.1
ЪѓЙ№ЁЇPetrography and whole-rock major and trace element analyses of igneous rocks from Iheya North Knoll, middle Okinawa Trough, SIP Expedition CK14-04 (Exp. 907)
Toru Yamasaki
ЁЪvol.123, no.1ЁЄp.23-29ЁЫ
Appendix Table 1 Analytical results of reference materials.
Appendix A: Methods
File No47ЁЇvol.122, no.12
ЯРРтЁЇЛГЗСИЉОБЦтКНЕжЄЫЖДЄоЄьЄы2 СиЄЮИХФХЧШТЯРбЪЊ
ЛГЬюАцЁЁХАЁІЬчГ№ХпМљЁІВУЦЃЯТЙРЁІЛГХФЁЁХиЁІГљХФЮДЛЫЁІКЃЬюЁЁПЪ
Two tsunami deposits in the Shonai Sand Dunes, northeast Japan
ЁЪvol.122, no.12ЁЄp.637-652ЁЫ
Appendix 1. Radiocarbon ages obtained for dateable materials from the event deposits.
File No46ЁЇvol.122, no.12
ЯРРтЁЇЕЊАЫШОХчЄЫЪЌЩлЄЙЄыЛЭЫќННТгЖХГЅМСКНДфЄЮКеЖ§РЅИЅыЅГЅѓЄЮU–Pb ЧЏТхЄШЄНЄЮАеЕС
ОяШзХЏЬщЁІУнЦтЁЁРПЁІЛжТМавЮМЁІТРХФЬРЮЄЁІЛГЫмЙнЛж
U–Pb ages of detrital zircon from the tuffaceous sandstone of the Shimanto Belt in the Kii
Peninsula
ЁЪvol.122, no.12ЁЄp.625-635ЁЫ
Appendix 1ЁС5. LA-ICP-MS U–Pb isotopic data. Analyses shown in italics are discordant dataЁЪprobability Ёх 0.1ЁЫ, and are not included in the probability density pot and histogram.
All errors are quoted at 2σ. 206PbcЁЇcommon 206Pb.
File No45ЁЇvol.122, no.10
ЯРРтЁЇДфРаГиХЊЄЫЄпЄПОТТєВаЛГЄЫЄЊЄБЄыЅоЅАЅоЮЏЄъЄЮФЙДќХЊПЪВНЄШЅЋЅыЅЧЅщЗСРЎЪЎВаЄЮНрШїВсФј
С§оМВТЛвЁІРаКъТйУЫЁІЧђАцУвПЮЁІООЫмАЁДѕЛвЁІЕмКфП№ЪцЁІУцРюИїЙА
Petrological investigation of long-term evolution of magma chambers and preparing processes of caldera-forming eruption, Numazawa volcano, NE Japan
Yoshiko Masubuchi, Yasuo Ishizaki, Tomohito Shirai, Akiko Matsumoto, Mizuho, Amma-Miyasaka and Mitsuhiro Nakagawa
ЁЪvol.122, no.10ЁЄp.533-550ЁЫ
Appendix. 1-4
File No44ЁЇvol.122, no.8
НфИЁАЦЦтНёЁЇЭеЛГ–ЮцВЌТгЅШЅщЅаЁМЅЙЁЪТш123ЧЏГиНбТчВёНфИЁCЅГЁМЅЙЁЫ
ЙтЖЖФОМљЁІМЦХФЗђАьЯКЁІЪПХФТчЦѓЁІПЗАцХФНЈАь
Geologic traverse from the Mineoka Belt to the Hayama Belt, Central Japan
Naoki Takahashi, Kenichiro Shibata, Daiji Hirata and Shuichi Niida
ЁЪvol.122, no.8ЁЄp.375-395ЁЫ
Appendix. CaptionЁЪPDFЁЫ
Appendix. 1ЁС11ЁЪPDFЁЫ
Appendix. 12ЁС21ЁЪPDFЁЫ
File No43ЁЇvol.122, no.4
ЯРРтЁЇЭјКЌРюФуУЯЄЫЄЊЄБЄыЁжЬяРИЄЮОЎГЄТрЁзЄЮИЁОк
ХФЪеЁЁПИЁІЫйЁЁЯТЬРЁІЩДИЖЁЁПЗЁІУцХчЁЁЮщ
Verification of the “Yayoi regression” in the Tonegawa Lowland, central Japan
Susumu Tanabe, Kazuaki Hori, Arata Momohara and Rei Nakashima
ЁЪvol.122, no.4ЁЄp.135-153ЁЫ
AppendixЄЮАьГчЅРЅІЅѓЅэЁМЅЩЁЪPDF;6.3MBЁЫ
Fig. A1. Stratigraphic columns of core sediments used in this study.
Fig. A2. Diatom assemblages. Relative abundances of marine–brackish–freshwater species (left) are expressed as percentages of the total number of frustules counted. Relative abundances of freshwater-species ecologies (right) are expressed as percentages of the total number of frustules counted in freshwater species. More than 100 frustules were counted from each sample. Black circles indicate that the counted frustules make up <1% of the total counted frustules.
Fig. A3. Photographs of plant macrofossils. (a) Ruppia rostellata fruit, (b) Najas marina seed, (c) Potamogeton distinctus fruit, (d) Trapa fruit (spine). Scale bar, 1 mm.
Table A1. Locations and penetration depths of sediment cores used in this study.
Table A2. Sea-level index points from Toyama Bay (Fujii,1992). Measured 14C ages were converted into conventional 14C ages using δ13C values of –27.5‰ and 0‰ for plant and shell, respectively.
File No42ЁЇvol.122, no.3
ЯРРтЁЇРжОыВаЛГЗкРаЪЎВаДќЄЮЅоЅАЅоЪЎНаЮЈЄШСШРЎЄЮЪбВН
ЛГИЕЙЇЙ
Magma-discharge rate and geochemical evolution during the pumice-eruption stage of Akagi Volcano, NE Japan.
Takahiro Yamamoto
ЁЪvol.122, no.3ЁЄp.109-126ЁЫ
AppendixЄЮАьГчЅРЅІЅѓЅэЁМЅЩЁЪPDF;1.4MBЁЫ
Appendix 1. List of outcrops.
Appendix 2. Major element contents of volcanic glass shards. obtaimed by EDX measurements.
Appendix 3. Whole rock chemical compositions of pumices. Major and trace-elements were measured by ICP optical and mass spectrometry.
Appendix 4-1. Thickness contours for the volcanic cone of younger Akagi Volcano.
Appendix 4-2. Thickness contours for the Itoi and Fudo Pumice Flow Deposits.
Appendix 4-3. Thickness contours for the Tanashita Pumice Flow Deposit.
Appendix 4-4. Thickness contours for the Fujiki Pumice Flow Deposit.
Appendix 4-5. Thickness contours for the Wakubara Pumice Flow Deposit.
Appendix 4-6. Thickness contours for the Ogo Pumice Flow Deposit.
Appendix 4-7. Thickness contours for the Toshimaru Pumice Flow Deposit.
Appendix 4-8. Thickness contours for the Nagumo Pumice Flow Deposit.
File No41ЁЇvol.122, no.3
ЯРРтЁЇЮђЛЫЛўТхЄЫЪЎНаЄЗЄПЦБАьВаЛГЭГЭшЄЮЗкРаСиЄЮЦБФъЁЇЕмКъЪПЬюЄЧИЋНаЄЕЄьЄПКљХчЪИЬРЅЦЅеЅщЄЮЮу
РИХФРЕЪИЁІУАБЉРЕЯТЁІУЩИЖ ХАЁІЛГВМ ЦЉЁІДнЛГРПЛЫЁІГљТьЙЇПЎЁІОЎЮгХЏЩзЁІЙѕпЗБбМљЁІдЂЪЌЁЪуЗЦЃЁЫЭлЛвЁІЪПХФГйЛЫ
Identification of pumice derived from historic eruption in the same volcano: Case study for the
Sakurajima-Bunmei tephra in the Miyazaki Plain.
Masafumi Ikuta, Masakazu Niwa, Tohru Danhara, Tohru Yamashita, Seiji Maruyama, Takanobu Kamataki, Tetsuo Kobayashi, Hideki Kurosawa, Yoko Saito-Kokubu and Takafumi Hirata
ЁЪvol.122, no.3ЁЄp.89-107ЁЫ
ЁЪЄНЄьЄОЄьЄЮПоШжЙцЄђЅЏЅъЅУЅЏЄЙЄыЄШPDFЄЌЅРЅІЅѓЅэЁМЅЩЄЧЄЄоЄЙЁЫ
Table S1. Chemical compositions of volcanic glass shards, determined by LA–ICP–MS.
File No40ЁЇvol.121, no.11
ЯРРтЁЇЛЭЙёУцБћЩєЄЮУцБћЙНТЄРўУЧСиТгРюОхУЧСиХьУМЩєЄЫЄЊЄБЄыЗВЮѓЅмЁМЅъЅѓЅАФДКК
УгХФЮбМЃЁІФдЁЁУвТчЁІИхЦЃНЈОМЁІФщЁЁЙРЧЗЁІЖНФХОЛЙЈЁІЬјХФЁЁРПЁІТчЬюЭЕЕЁІРОКфФОМљ
Arrayed-boring survey near the eastern end of the Kawakami fault of the Median Tectonic Line Active Fault Zone in central Shikoku, southwest Japan
Michiharu Ikeda, Tomohiro Tsuji, Hideaki Goto, Hiroyuki Tsutsumi, Masahiro OkitsuЁЄMakoto Yanagida, Yuki Ohno and Naoki Nishizaka
ЁЪvol.121, no.11ЁЄp.403-419ЁЫ
ЁЪЄНЄьЄОЄьЄЮПоШжЙцЄђЅЏЅъЅУЅЏЄЙЄыЄШPDFЄЌЅРЅІЅѓЅэЁМЅЩЄЧЄЄоЄЙЁЫ
Appendix 1. TPhotographs of each core (Br. A to Br. D). Yellow and red dashed outlines indicate Unit 2 and Unit 4, respectively. Unit 4 occurs in Br. A, Br. B and Br. C, but not in Br. D. Small numerals show depth in meters.
Appendix 2. Photographs and unit sub-divisions in the depth range –9.4 to –10.4 m of Br. D. Small numerals show elevation in meters.
File No39ЁЇvol.121, no.10
ЯРРтЁЇЫМСэШОХчЁЄПЗТшЛАЗЯАТЫМСиЗВОхЩєЄЮthin-skin ЪбЗСЄШъљЖЪ
ИХГбЙИЭЮЁІКДЦЃГшЛжЁІЛГЯЉЁЁЦи
The thin-skinned deformations and folding of the upper Awa Group (Neogene) in the Boso Peninsula, Japan
Akihiro Kokado, Katsushi Sato and Atsushi Yamaji
ЁЪvol.121, no.10ЁЄp.359-372ЁЫ
ЅеЅЁЅЄЅыЅРЅІЅѓЅэЁМЅЩЄЯЄГЄСЄщ
Appendix A. Tuff marker beds originally identified by the author.
Appendix B. Fault-slip data for the Amatsu, Kiyosumi, and Anno formations in the study area. F, ‘full’ fault-slip data which consist of orientations of the fault planes, lineations,and senses of movements; L, ‘line-only’ fault-slip data which lack senses of movements; S, ‘sense-only’ fault-slip data which lack orientations of lineations; N, normal shear sense; R, reverse shear sense; D, dextral shear sense; S,sinistral shear sense; U, unknown shear sense.
Appendix C. Route map in the study area, showing the locations where fault-slip data were obtained.
File No38ЁЇvol.120, no.7
ЯРРтЁЇАЫЦІТчХч2013 ЧЏЅщЅЯЁМЅыЄЮТЯРбГиХЊЦУФЇЁЇЅщЅЯЁМЅыТЯРбЪЊЄЮЮГХйСШРЎЄЫЄшЄыЪЌЮр
ЛГИЕЙЇЙЁІРюЪеФїЕз
Sedimentary characteristics of the Izu-Oshima 2013 lahar: classification of various lahar deposits based on grain-size distribution
Takahiro Yamamoto and Yoshihisa Kawanabe
ЁЪvol.120, no.7ЁЄp.233-245ЁЫ
ЅеЅЁЅЄЅыЅРЅІЅѓЅэЁМЅЩЄЯЄГЄСЄщ
Appendix 1. Sample list.
File No37ЁЇvol.120, no.4
ЯРРтЁЇШЂКЌВаЛГЗВЁЄЖЏЭхЩеЖсЄЮИхЅЋЅыЅЧЅщУЯМСШЏУЃЛЫ
шпЧЏАьЙф
Post-caldera geology of Gora Region in Hakone Volcano Group, Japan
Kazutaka Mannen
ЁЪvol.120, no.4ЁЄp.117-136ЁЫ
ЅеЅЁЅЄЅыЅРЅІЅѓЅэЁМЅЩЄЯЄГЄСЄщ
Open file 1 Selected pollen diagrams for the #5, #6, #10, #41, and JMA wells. See Fig. 3 for well locations.
Open file 2 Number and percentage of fossil pollen grains in unit 6 of the JMA-V29 borehole.
Open file 3 Fossil diatoms in unit 6 of the JMA-V29 borehole.
Open file 4 Whole-rock major element (wt%) and trace element (ppm) compositions of volcanic clasts in JMA-V29 borehole samples, as determined by XRF.
Open file 5 Whole-rock major element (wt%) and trace element (ppm) compositions of volcanic clasts and lavas samples from boreholes near borehole JMA-V29, as determined by XRF.
File No36ЁЇvol.120, no.2
ЯРРтЁЇZircon U–Pb age and its geological significance of late Carboniferous and Early Cretaceous adakitic granites from eastern margin of the Abukuma Mountains, Japan
Nobutaka Tsuchiya, Tomoyo Takeda, ,Kenichiro Tani, Tatsuro Adachi, Nobuhiko Nakano, Yasuhito Osanai and Jun-Ichi Kimura
ЁЪvol.120, no.2ЁЄp.37-51ЁЫ
ЅеЅЁЅЄЅыЅРЅІЅѓЅэЁМЅЩЄЯЄГЄСЄщ
Open file 1. Petrography of analyzed samples.
Open file 2. Photomicrographs of the‘ Wariyama Sheared Granodiorite.’ A: Medium-grained tonalite (KAKUDA7, PPL); B: medium-grained tonalite (KAKUDA7, CPL); C: medium-grained tonalite (KAKUDA9, PPL); D: medium-grained tonalite (KAKUDA9, CPL); E: coarse-grained quartz diorite (11111322, PPL); F: coarse-grained quartz diorite (11111322, CPL); G: coarse-grained tonalite (11111205, PPL); H: coarsegrained tonalite (11111205, CPL). Abbreviations, Hbl: hornblende; Bt: biotite; Pl: plagioclase; Kfs: K-feldspar; Qtz: quartz; Ttn: titanite; PPL: plain polarized light; CPL: crossed polarized light.
Open file 3. Sampling locality.
File No35ЁЇvol.119, no.12
ЯРРтЁЇРОЦюЫЬГЄЦЛЁЄЙЙПЗРЄХЯХчОЎХчВаЛГЄЮУЯМСЄШДфРаГиХЊЦУФЇ
ОЎПљАТЭГШўЁІУцРюИїЙАЁІРЖЬюДВЛв
ЁЪvol.119, no.12ЁЄp.743-758ЁЫ
ЅеЅЁЅЄЅыЅРЅІЅѓЅэЁМЅЩЄЯЄГЄСЄщ
Appendix 1. Whole-rock chemical compositions of representative samples from the Oshima-Kojima volcano. Unit names are as in Table 1. Sample localities are shown in Fig. 3.
Appendix 2. Sr and Nd isotopic compositions of wholerock samples from the Kariba-yama, Oshima-Oshima, and Megata volcanoes.
File No34ЁЇvol.119, no.10
ЪѓЙ№ЁЇЅЙЅШЅщЅІЅжЫЁЄЫЄшЄыЅЗЁМЅШОѕЅПЁМЅгЅРЅЄЅШСиЮпНХЭЭМАЄЮФъЮЬИЁНаЁЇЫМСэШОХчУцПЗХ§ЁнСЏПЗХ§РЖРЁСиЄЮЮу
БКЫмЙыАьЯКЁІРЖВШАьЧЯ
ЁЪvol.119, no.10ЁЄp.693-698ЁЫ
ЅеЅЁЅЄЅыЅРЅІЅѓЅэЁМЅЩЄЯЄГЄСЄщ
ЂўAppendix 1. Equations of the modified Straub method for mesuring the standard deviation of the sedimentation rate within a given measurement time window for the discretized terrestrial outcrop data (Uramoto and Seike, 2012).
File No33ЁЇvol.119, no.10
ЯРРтЁЇВЦьХчЄЊЄшЄгМўЪеНєХчЄЫЪЌЩлЄЙЄыРшПЗТшЛАЗЯД№ШзДфЮрЄЮСДДфВНГиСШРЎЄШКеЖ§РЅЖЅЏЅэРаВНГиСШРЎЁЅ
ЕмОыФОМљЁІЧЯОьСдТРЯКЁІПЗОыЮЕАь
ЁЪvol.119, no.10ЁЄp.665–678ЁЫ
ЅеЅЁЅЄЅыЅРЅІЅѓЅэЁМЅЩЄЯЄГЄСЄщ
Table 1. Representative major (oxides: wt.%) and trace elements (in ppm) compositions of sandstones in the study areaЁЅ
Table 2. Representative major (oxides: wt.%) and trace element (in ppm) compositions of greenstones in the study areaЁЅ
Table 3. Representative chemical composition of detrital garnet.
File No32ЁЇvol.119, no.7
ЯРРтЁЇОяЮІТцУЯЄЫЄЊЄБЄыВМСэСиЗВЬкВМСиЄЮЅЦЅеЅщСиНјЄШЙАшТаШц
ТчАцПЎЛАЁІВЃЛГЫЇНеЁІРОЯЂУЯПЎУЫЁІАТЦЃМїУЫ
ЁЪvol.119, no.7ЁЄp.488–505ЁЫ
ЅеЅЁЅЄЅыЅРЅІЅѓЅэЁМЅЩЄЯЄГЄСЄщ
ЂўAppendix 1. Locations of the studied outcrops.
ЂўAppendix 2. Average major element chemistry of glass shards in tephra layers from the Kioroshi Formation of the Upper Pleistocene Shimosa Group in the Hitachi Terraces. (a) Br-Sc, Bk-Sc, ArP, Nk-Yt, TAu-3, Ob, TAu-9, OiP, KtP, Tephra 20 (1), and Nm-SB. Refer to Fig. 1 for locations of the tephra samples. n: number of analyses. Standard deviations are shown below the average values. *1: Ooi and Yokoyama (2011), *2 measured by SEM with a wide beam to cover a larger analytical area.
File No31ЁЇvol.119, no.7
ЯРРтЁЇХьЫЬЦќЫмЁЄРчДфУЯЧЎУЯАшЦюЩєЁЄЙтСвВаЛГЄЮЛГТЮЗСРЎЛЫЄШЅоЅАЅоЖЁЕыЗЯ
УцУЋКщЛвЁІФЙУЋРюЁЁЗђЁІЦЃЦьЬРЩЇЁІОШАцШЅЛв
ЁЪvol.119, no.7ЁЄp.457–473ЁЫ
ЅеЅЁЅЄЅыЅРЅІЅѓЅэЁМЅЩЄЯЄГЄСЄщ
ЂўAppendix 1. Petrography of the Takinosawa and Takakurasan lava series. – = not found, E = euhedral, S = subhedral, A = anhedral, IG = intergranular, IS = intersertal.
ЂўAppendix 2. Sample location map showing sample numbers and localities based on Fig. 5.
File No30ЁЇvol.119, no.6
ЯРРтЁЇЯТРєЛГЬЎУЯАшЄЫЄЊЄБЄыЯТРєСиЗВЄЮЭЕЁЪЊНЯРЎЄШТЯРбЫпЄЮЫфЫзЅтЅЧЅыЁЅ
РЖВШАьЧЯЁІЪПЬюЙАЦЛ
ЁЪvol.119, no.6ЁЄp.397–409ЁЫ
ЅеЅЁЅЄЅыЅРЅІЅѓЅэЁМЅЩЄЯЄГЄСЄщ
ЂўAppendix 1. List of samples from the Izumi Mountains, Kinki district, and the Asan Mountains, Shikoku Island. * = Distance from the northern marginal unconformity of the Izumi sedimentary basin; ** = Basin width distance; *** = Distance from Matsuyama (132°42’00” E).
ЂўAppendix 2. Sample localities of Suzuki (1996) and values of mean random vitrinite reflectance (Rm) converted from maximum vitrinite reflectance (Rmax) values of Suzuki (1996). * = Rm value; ** = Estimates based on Koch and Gunther (1995), using Rm = 0.7469Rmax + 0.2241; *** = Distance from the northern end of the northern marginal facies; **** = Basin width distance; ***** = Distance from Matsuyama (132°42’00” E).
ЂўAppendix 3. Random vitrinite reflectance (Rr) histograms for 43 samples from the Izumi Group. Class width of each population is 0.05% reflectance; triangles indicate the mean values (Rm) for each sample.
ЂўAppendix 4. Mean random vitrinite reflectance (Rm) and Rock-Eval Tmax values for the Izumi Group of the Izumi Mountains and the Asan Mountains. Maximum paleotemperatures (Tpeak) were estimated using (A) Tpeak = 104 ln (Rm) + 148 (Barker , 1988), and (B) Tpeak = (ln(Rm) + 1.68)/0.0124 (Barker and Pawlewicz, 1994). Std = standard deviation; “n.d.” denotes not measured.
ЁЁЁЁ
File No27ЁЇvol.119, no.4
ЯРРтЁЇХчКЌИЉНаБРЛдЦюЪ§УЯАшЄЫЄЊЄБЄыУцПЗХ§ЄЮK–Ar ЧЏТхЄШИХУЯМЇЕЄЪ§АЬ
ТєХФНчЙАЁІЛАТхДюЙАЁІКЃВЌОШДюЁІЕШХФРЛХЕЁІА№ХФЭ§КЛЁІЕзАцЯТЦСЁІЖсЦЃЁЁПЮЁІЪМЦЌРЏЙЌ
(vol.119, no.4ЁЁp.267-284)
ЅеЅЁЅЄЅыЅРЅІЅѓЅэЁМЅЩЄЯЄГЄСЄщ
ЂўTable 1. Mineral K–Ar ages of analyzed samples from the Miocene in the southern Izumo Basin with the sample number, rock type, formation, occurrence and location (longitude and latitude) of analyzed samples.
ЂўTable 2. Whole rock K-Ar ages of analyzed samples from the Miocene in the southern Izumo Basin with the sample number, rock type, formation, occurrence and location (longitude and latitude) of analyzed samples.
ЂўTable 3.Paleomagnetic directions of the Miocene and the Yoshida Plutonic Complex in the Izumo Basin.
ЂўTable 4. Whole rock K–Ar ages of the Miocene in Ohda and Yasugi cities, Shimane Prefecture(Sawada and Itaya, unpublished data) with the sample number, rock type, formation, occurrence and location (longitude and latitude) of analyzed samples.
ЩеЯП.ЁЁK-ArЧЏТхТЌФъЄЫЭбЄЄЄщЄьЄПДфРаЛюЮСЄЮЕКм
File No26ЁЇvol.119, no.3
ЯРРтЁЇЅеЁМЅъЅЈВђРЯЄШЅеЅщЅЏЅПЅыМЁИЕЄЫЄшЄыКеЖ§ЪЊЮГЗСЄЮФъЮЬЪ§ЫЁЄШТЯРбОьШНЪЬЪ§ЫЁЄЮФѓМЈ
ЮыЬкЗФТРЁІМђАцЫЎЭЕЁІТРХФЁЁЕќ
(vol.119, no.3ЁЁp.205-216)
ЂўAppendix 1. Scores of each index for all particles obtained during this study.
ЂўAppendix 2. Output files giving the results of principal component analysis; the PCR file enables the calculation of EF1, EF2, and EF3 scores for any given grain, and the PDF file contains Appendix 2a–e.
File No25ЁЇvol.119, no.1
ЅЮЁМЅШЁЇПНЬМЋКпАѕКўЭбЅеЅЃЅыЅрЄђГшЭбЄЗЄПЮЉТЮУЯЗСЅтЅЧЅыЄЮКюРНЄШЄНЄЮЖЕКрВНЄЮЛюЄп
АЫЦЃЁЁЙЇЁІВЌКъУвФсЛвЁІМЧИЖЖЧЩЇЁІпЗТМЁЁДВЁІЛАХФФОМљ
(vol.119, no.1ЁЁp.39-44)
ЅеЅЁЅЄЅыЅРЅІЅѓЅэЁМЅЩЄЯЄГЄСЄщ
ЂўOpen File 1. Outline of the preparation techniques used informing a solid geomorphological model covered with mapprinted OK film.
ЂўOpen File 2. View of the laboratory used for classes, focusing on covering a solid geomorphological model with mapprinted OK film, (1) outlining of the procedures involved in OK film covering and examples of potential applications, (2) removal of extraneous OK film with scissors, (3) application of special adhesive onto the cast surface using the index finger, and (4) drying the OK film-covered casts using hairdryers.
ЂўOpen File 3. Timetable for a laboratory class focusing on forming a solid geomorphological model covered with mapprinted OK film, and observation of the model produced during the class in Earth Science Experiment B.
File No24ЁЇvol.118, no.11
ЅЮЁМЅШЁЇ213 nm Nd-YAG ЅьЁМЅЖЁМЅЂЅжЅьЁМЅЗЅчЅѓICP МСЮЬЪЌРЯСѕУжЄђЭбЄЄЄПЅИЅыЅГЅѓЄЮU-Pb ЖЩНъЧЏТхЪЌРЯЁЇSHRIMP ЅЧЁМЅПЄШЄЮРАЙчРЄЮИЁЦЄ
ОЁЩєАЁЬ№ЁІСсКфЙЏЮДЁІКфИ§ЁЁАНЁІЙтЖЖВХЩз
(vol.118, no.11ЁЁp.762-767)
ЂўAppendix 1. LA-ICP-MS isotopic data for standard zircons (Plešovice, SL13, AS3, QGNG).
File No23ЁЇvol.118, no.11
ЯРРтЁЇЫЬГЄЦЛЦќЙтТгЅнЅэЅЗЅъЅЊЅеЅЃЅЊЅщЅЄЅШЫЬЩєУЯАшЄЮУЯМСЄШЪбРЎКюЭб
ХФУцППЦѓЁІЬкКъЗђМЃЁІЕмВМНуЩз
(vol.118, no.11ЁЁp.723-740)
ЂўTable A1. Representative amphibole analyses showing compositional zoning in porphyroclast cores and rims and in matrix amphiboles within upper schistose amphibolite in the Chiroro River area.
ЂўTable A2. Representative analyses of amphibole from greenschist, upper schistose amphibolite, and later dolerite dykes in the Chiroro River area.
ЂўTable A3. Representative analyses of plagioclase from greenschist, upper schistose amphibolite, and later dolerite dykes in the Chiroro River area.
File No22ЁЇvol.118, no.6
ЅЮЁМЅШЁЇЬюГАМТНЌЄШММЦтМТИГЄђМшЄъЦўЄьЄПГиЙЛЖЕАїИўЄБНфИЁЄЮМТСЉЪѓЙ№ЁЇУЯСиЄЯЄЎМшЄъЩИЫмЄШДЪАзПхЯЉМТИГЄЮМјЖШЄЧЄЮГшЭбЄђЬмЛиЄЗЄЦ
ПЂЬкГйРуЁІАЫЦЃЁЁЙЇЁІУцЬюБбЧЗЁІОЎШјЁЁЬїЁІЫвЬюТйЩЇ
(vol.118, no.6ЁЁp.387-392.)
ЂўTable A. Questionnaire items.
ЂўTable B. Reasons given by participants for their choice of the most impressive stop during the excursion.
ЂўTable C. Improvements to the excursion suggested by participants.
ЂўTable D. How to use a peel specimen of sediments in a school lesson, as suggested by participants.
ЂўTable E. How to conduct a simplified flume experiment in a school lesson, as suggested by participants.
ЂўTable F. Other impressions of the entire excursion from participants.
ЂўTable G. References on the implementation of earth science education in schools using regional materials.
ЁкTable A–G. PDFЁл
File No28ЁЇvol.118, no.4
ЯРРтЁЇЛЭЙёЫЬРОЩєЄЮУцБћЙНТЄРўГшУЧСиЗЯАЫЭНУЧСиЄЮДАПЗРЄГшЦАЭњЮђ
УгХФЮбМЃЁЄИхЦЃНЈОМЁЄФщЁЁЙРЧЗЁЄЯЊИ§ЙЬМЃЁЄТчЬюЭЕЕЁЄРОКфФОМљЁЄОЎЮгНЄЦѓ
(vol.118, no.4ЁЁp.220-235.)
ЂўTable 1. Description of strata exposed on the Miaki trench walls.
ЂўTable 2. Radiocarbon ages for samples from the Miaki trench site.
ЂўTable 3. Description of strata exposed on the Ichiba trench walls.
ЂўTable 4. Radiocarbon ages for samples from the Ichiba trench site.
ЁкTable 1–4Ёл
File No29ЁЇvol.118, no.1
ЯРРтЁЇLA-ICP-MS U–Pb zircon and FE-EPMA U–Th–Pb monazite dating of pelitic granulites from the Mt. Ukidake area, Sefuri Mountains, northern Kyushu
Adachi, T., Osanai, Y., Nakano, N. and Owada, M.,
(vol.118, no.1ЁЁp.39-52.)
ЂўFig. A1. Representative time-resolved isotopic ratio profiles determined by ablation of zircons from Temora (a) and an unknown sample (060101A) (b). In the case of these analyses, isotopic ratios are consistent between 48 to 120 s for the Temora sample and 53 and 120 s for sample 060101A. These portions of data were integrated and then calibrated during age determination.
ЂўTable A1. Short- and long-term precision of U–Pb isotope ratios and calculated ages of the FC-1 zircon standard.
ЂўTable A2. U–Pb isotope ratios and calculated ages from analysis of zircons from Temora and the Itoshima granodiorites calibrated against the FC-1 zircon standard.
ЂўTable A3. Comparison of U–Pb isotope ratios and calculated age data from analysis of the FC-1 zircon with different laser beam diameters.
ЂўTable A4. Chemical compositions and U–Th–Pb ages of reference monazites.
ЁкFig. A1ЁЄTable 1–4Ёл
File No21ЁЇvol.117, no.10
СэРтЁЇУЯМСГиЄЫЄЊЄБЄыЪ§ИўЅЧЁМЅПВђРЯЫЁЁЇБпМўЅЧЁМЅПЄЮХ§ЗзГи
ПЗАцЙЈВХ
(vol.117, no.10ЁЁp.547-564.)
ЂўAppendix 1. (PDF) Synthetic circular data (100 random deviates in each case) drawn from circular distributions.
ЂўAppendix 2. (PDF) Applications of circular statistics software.
File No20ЁЇvol.117, no.8
ЯРРтЁЇЕмОыИЉВТчУЯПЬЄЮСАУћЄђТЊЄЈЄыЄПЄсЄЮПМСиУЯВМПхЪбЦАИІЕцЁЇ2008ЧЏ2ЗюЁС2009ЧЏ12ЗюЄЮДбТЌЗыВЬ
МЏХчЭКВ№ЁІЦюПмИЖШўЗУЁІУцТМЮДЛжЁІЛГЦтОяРИЁІТчФаЗћЛЭЯК
(vol.117, no.8ЁЁp.451-467.)
ЂўFig. A (PDF)
Hourly data of the groundwater temperature, water level and the precipitation during 2008 and 2009 at the Atago (AT, Fig. Aa), Yamoto (YM, Fig. Ab) and Minamikata (MN, Fig. Ac) observation sites. BAYTAP-G was applied to the hourly data of water level from all observation sites using the barometric pressure as an associate data. The smooth component output from BAYTAP-G is approximated by the linear equations for the data from the AT and YM observation sites, while approximated by a 3rd-order polynomial equation for the data from the MN observation site. The values of water level shown in the figures represent the residuals of the smooth component from these regression equations. Since the raw data of groundwater temperature from all observation sites contains only very small components of the tidal and barometric effects, BAYTAP-G was not applied. The raw data from the AT and YM observation sites and those before April 16, 2009 from the MN observation site were approximated by a 2nd-order polynomial equation, a linear equation and a 4th-order polynomial equation, respectively. The water temperature data after June 12, 2009 from the MN observation site contain the significant daily fluctuations of unknown causes. After they were removed by the Fourier inverse transform, they were approximated by a 2nd-order polynomial equation. The residuals from these regression equations were plotted in the figures. The data of precipitation obtained from the nearby observatories of Japan Meteorological Agency show the time-series clusters. The cumulative precipitations for every cluster are plotted in the figure. Numerals 1, 2, 3 and 4 in circles denote the times of the off-Ibaraki Prefecture earthquake (MJ7.0) on May 8, 2008, Iwate-Miyagi inland earthquake (MJ7.2) on June 14, 2008, off-Fukushima Prefecture earthquake (MJ6.9) on July 19, 2008, and the northern Iwate prefecture coast earthquake on July 24, 2008 (MJ6.8). Note that the observed water level at the MN observation site after the Iwate-Miyagi inland earthquake is 400 mm lower than those shown in Fig. Ac.
File No19ЁЇvol.117, no.6
ЯРРтЁЇЪЎНаЪЊЄЮЙНРЎЪЊСШРЎЄШЫмМСЪЊМСЄЮСДДфЄЊЄшЄгЙлЪЊСШРЎЄЋЄщИЋЄПХЅТєВаЛГЄЮBC3400ЅЋЅыЅЧЅщЗСРЎЪЎВаЁЪХЅТєИаЪЎВаЁЫЄЮЅоЅАЅоЖЁЕыЗЯ
С§оМВТЛвЁІРаКъТйУЫ
(vol.117, no.6ЁЁp.357-376.)
ЂўAppendix 1. (PDF) Representative modal compositions
Sampling sites and stratigraphic levels are shown in Figs. 1, 2 and 7. Abbreviations: WP, white pumice; GP, gray pumice; BS, black scoria; GS, gray scoria; Pl, plagioclase; Amp, amphibole; Opx, orthopyroxene; Qtz, quartz; Opq, opaque minerals; Xe, xenolith; Ph, phenocryst.
ЂўAppendix 2. (PDF) Representative whole-rock compositions.
Total Fe expressed as Fe2O3. For plotting on the Harker diagrams (Fig. 7), the FeO* is assumed to be FeO + 0.8998 Fe2O3. Sampling sites and stratigraphic levels are shown in Figs. 1, 2, 3 and 6. Abbreviations: WP, white pumice; GP, gray pumice; BS, black scoria; GS, gray scoria.
ЂўAppendix 3. (PDF) Representative silicate mineral compositions (core compositions). Abbreviations: WP, white pumice; GP, gray pumice; BS, black scoria; GS, gray scoria.
* An = 100 × Ca/(Ca + Na + K) in cation units.
** Mg# = 100 × Mg/(Mg + Fet) in cation units, where Fet is total Fe, as Fe2+.
ЂўAppendix 4. (PDF) Composition of coexisting Fe-Ti oxides Abbreviations: WP, white pumice; GP, gray pumice; BS, black scoria; GS, gray scoria; Mag, magnetite; Ilm, ilmenite; XUlv, mole fraction of ulvöspinel; XIlm, mole fraction of ilmenite.
* Calculated using the method of Stormer (1983).
** Calculated using the QUILF 6.42 software package (Anderson et al., 1993) applying technique of Manley and Bacon (2000). The pressure dependence of the geothermometer is slight, and a pressure of 200 MPa was assumed in all calculations.
File No18ЁЇvol.117, no.5
ЯРРтЁЇПЗГуТЯРбЫпМЗУЋСиУцЄЫИЋЄФЄЋЄУЄПУцДќУцПЗРЄЙАшЅЦЅеЅщЁЇKbiЅЦЅеЅщЄШЕЊАЫШОХчММРИВаКеЮЎТЯРбЪЊЄЮТаШц
ЙЉЦЃЁЁПђЁІУЩИЖЁЁХАЁІДфЬюБбМљЁІЛГВМЁЁЦЉЁІЛАЮиШўУвЛвЁІЪПООЁЁЮЯЁІЬјТєЙЌЩз
(vol.117, no.5ЁЁp.277-288.)
ЂўFig. 1. Photomicrograph of reddish and colorless zircons from the Kbi tephra.
File No17ЁЇvol.116, no.10
СэРтЁЇГЗСУюЄЮГЬЄЮMg/CaШц, Sr/CaШцЄЫЄшЄыИХДФЖПфФъЄЮИНОѕЄШЬфТъХР
ПЙВМУЮЙИЁІЛГИ§ЮЖЩЇЁІтУМЦЕзЯТЁІПРУЋЮДЙЈ
(vol.116, no.10ЁЁp.523-543.)
ЂўAppendix 1. (PDF)Results of statistic tests. Abbreviations: S.D. = standard deviation, N = number of analyses, df = degree of freedom. The result of the tests follows: n.s., no significance; *, p<0.05; **, p<0.01ЁЅ
ЂўAppendix 2. (PDF)Superfamily, family, locality, Taxon Codes, and references of the examined ostracode taxa.
File No16ЁЇvol.115, no.8
ЪѓЙ№ЁЇЕЊАЫШОХчЁЄУцПЗРЄВаРЎДфЮрЄЮЅЂЅбЅПЅЄЅШЄЮЅеЅЃЅУЅЗЅчЅѓЁІЅШЅщЅУЅЏЧЏТх
ДфЬюБбМљЁІУЩИЖЁЁХАЁІРБЁЁЧюЙЌ
(vol.115, no.8ЁЁp.427-432.)
ЂўFig. A1.Analytical results of the sample MR1-Fl(Ap).
ЂўFig. A2.Analytical results of the sample MR70(Ap).
ЂўFig. A3.ЁЁAnalytical results of the sample SKB2(Ap).
ЂўFig. A4.ЁЁAnalytical results of the sample SKB2(Ap)_2.
ЂўFig. A5.ЁЁAnalytical results of the sample SKB2(Ap)_3.
ЂўFig. A6.ЁЁAnalytical results of the sample KSSP(Ap).
ЂўFig. A7.ЁЁAnalytical results of the sample AS01(Ap).
ЂўFig. A8.ЁЁAnalytical results of the sample TG02(Ap).
ЂўFig. A9.ЁЁAnalytical results of the sample KAR-N3(Ap).
ЂўFig. A10.ЁЁAnalytical results of the sample KAR4e(Ap).
ЂўFig. A11.ЁЁAnalytical results of the sample KAR5(Ap).
ЂўFig. A12.ЁЁAnalytical results of the sample KOZA2(Ap)
File No15ЁЇvol.115, no.6
ЯРРтЁЇЬыЕзЬюЅЊЅеЅЃЅЊЅщЅЄЅШФЋЭшДфТЮЄЫЄЊЄБЄыИХРИТхГЄЭЮЦтХчИЬУЯГЬЄЮЗСРЎЄШПЪВНВсФј
ЖљХФОЭИїЁІСсКфЙЏЮД
(vol.115, no.6ЁЁp.266-287.)
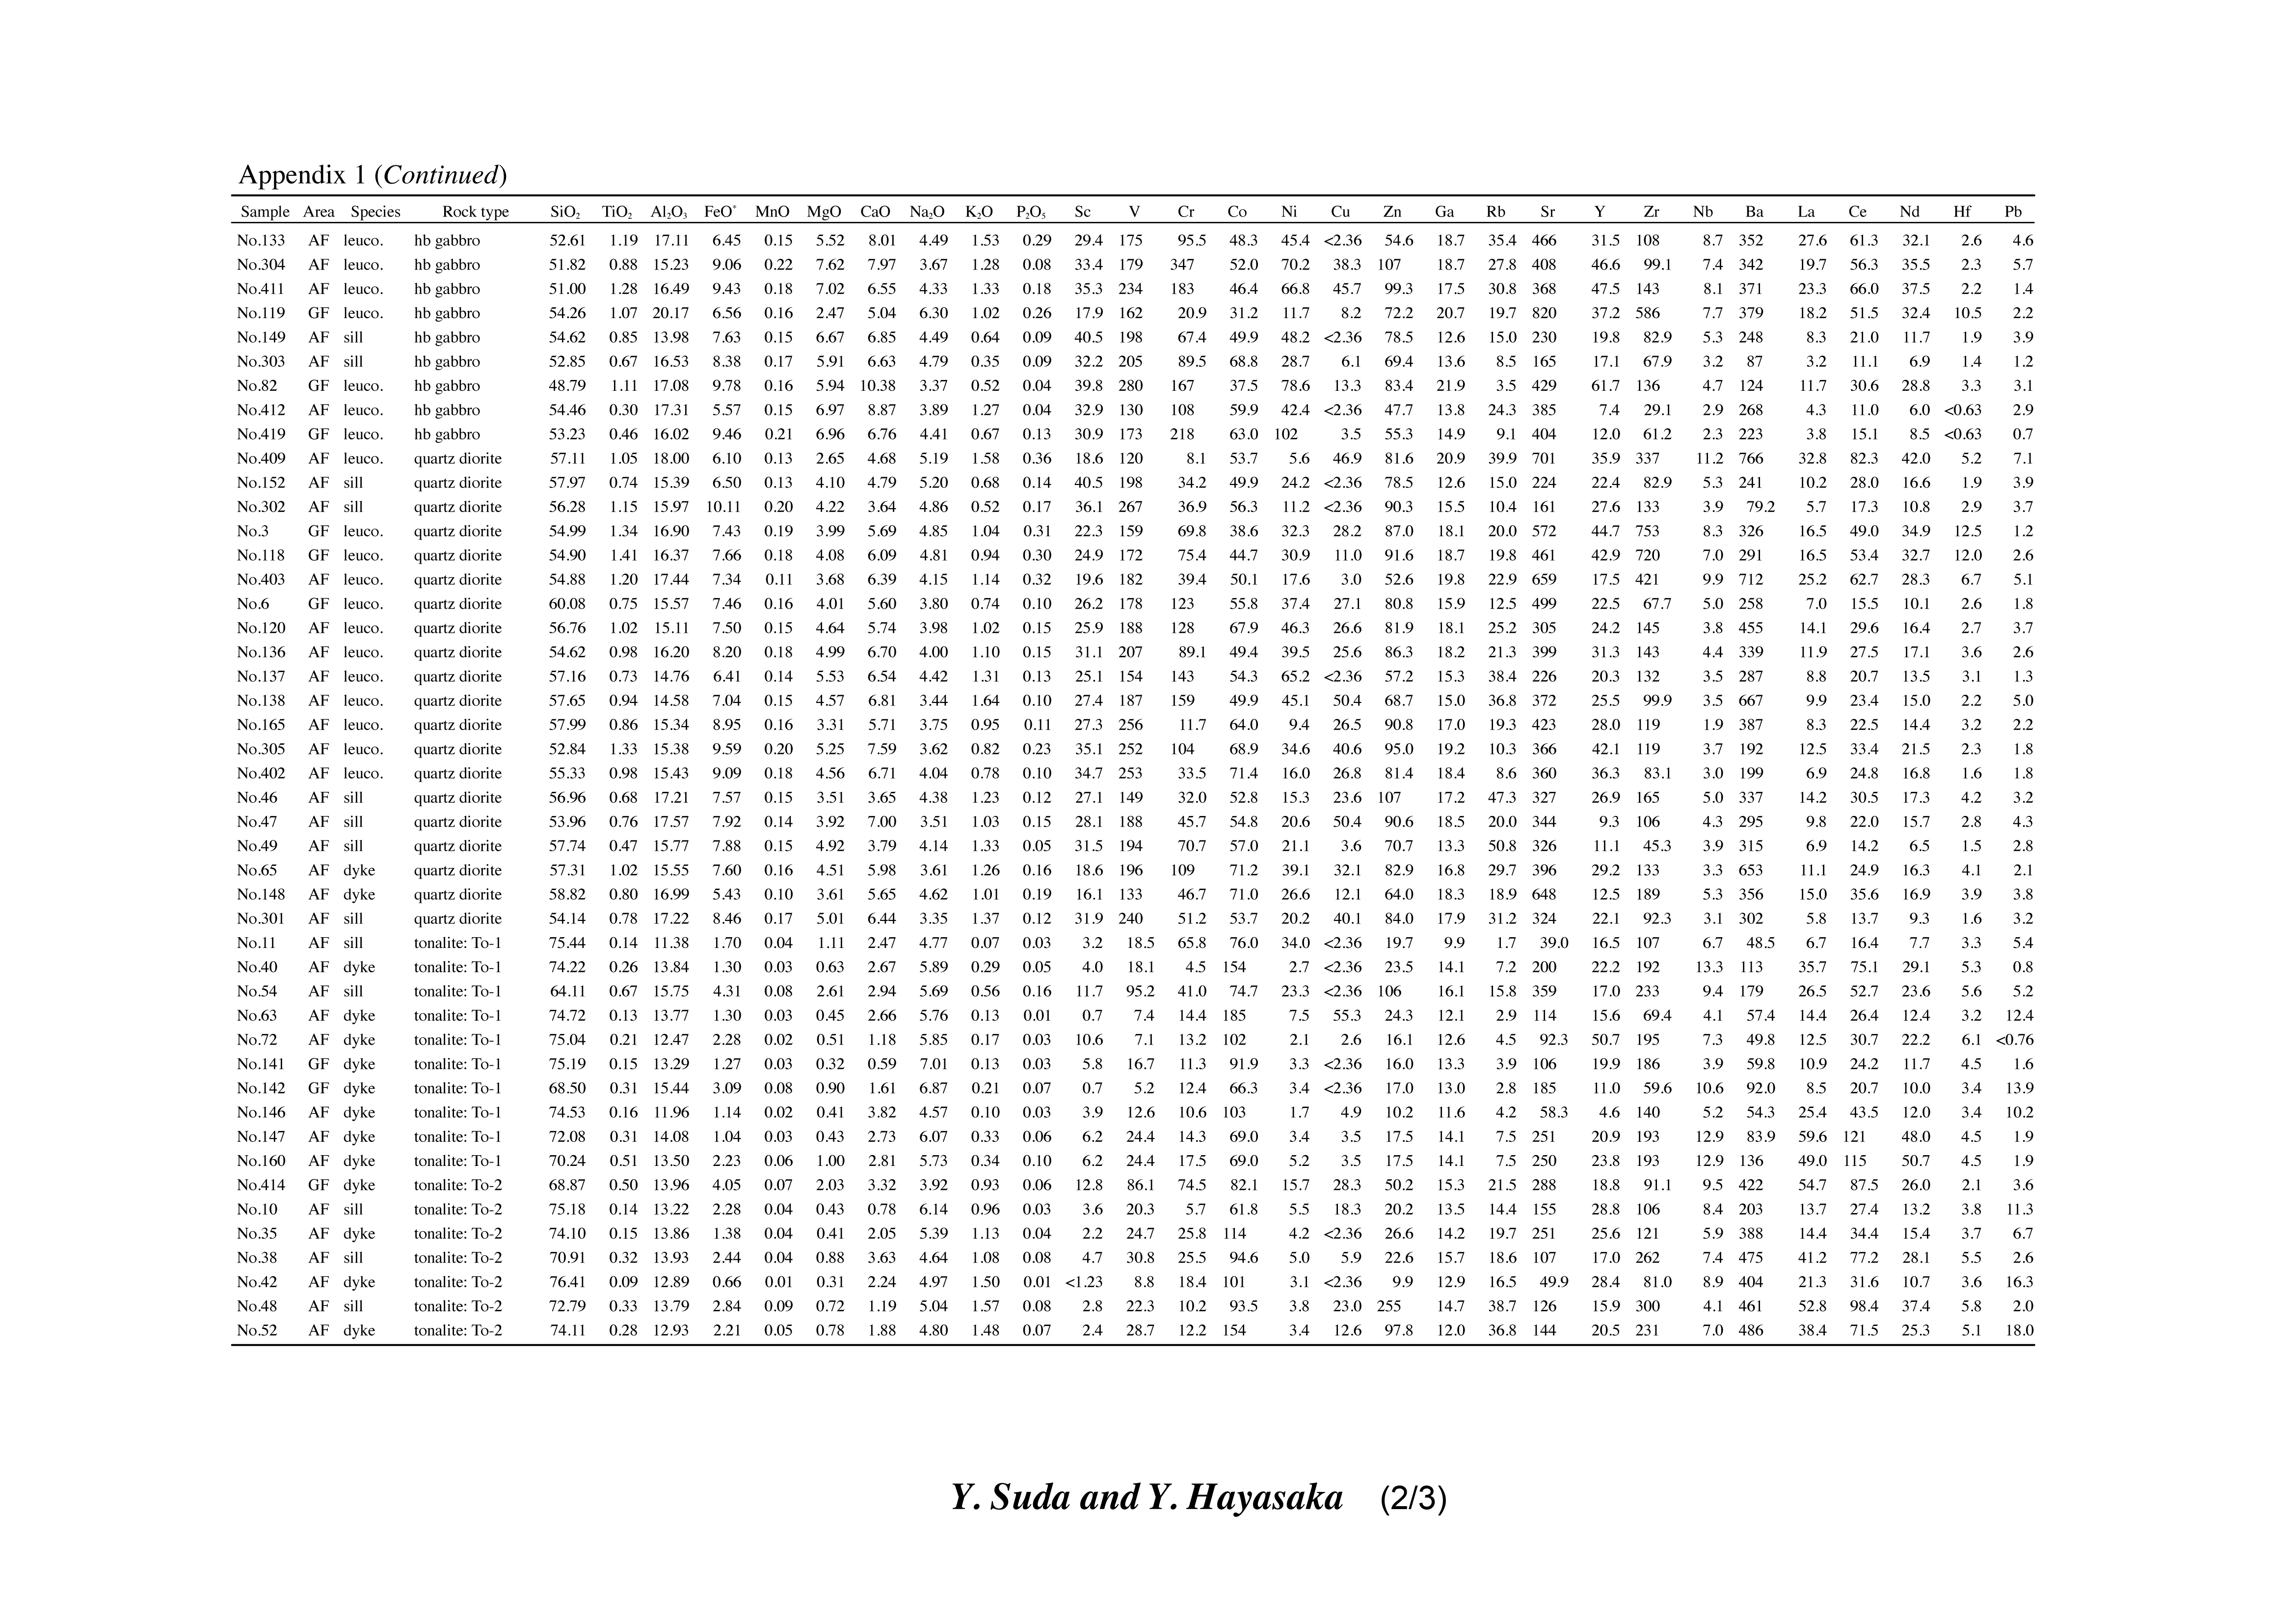
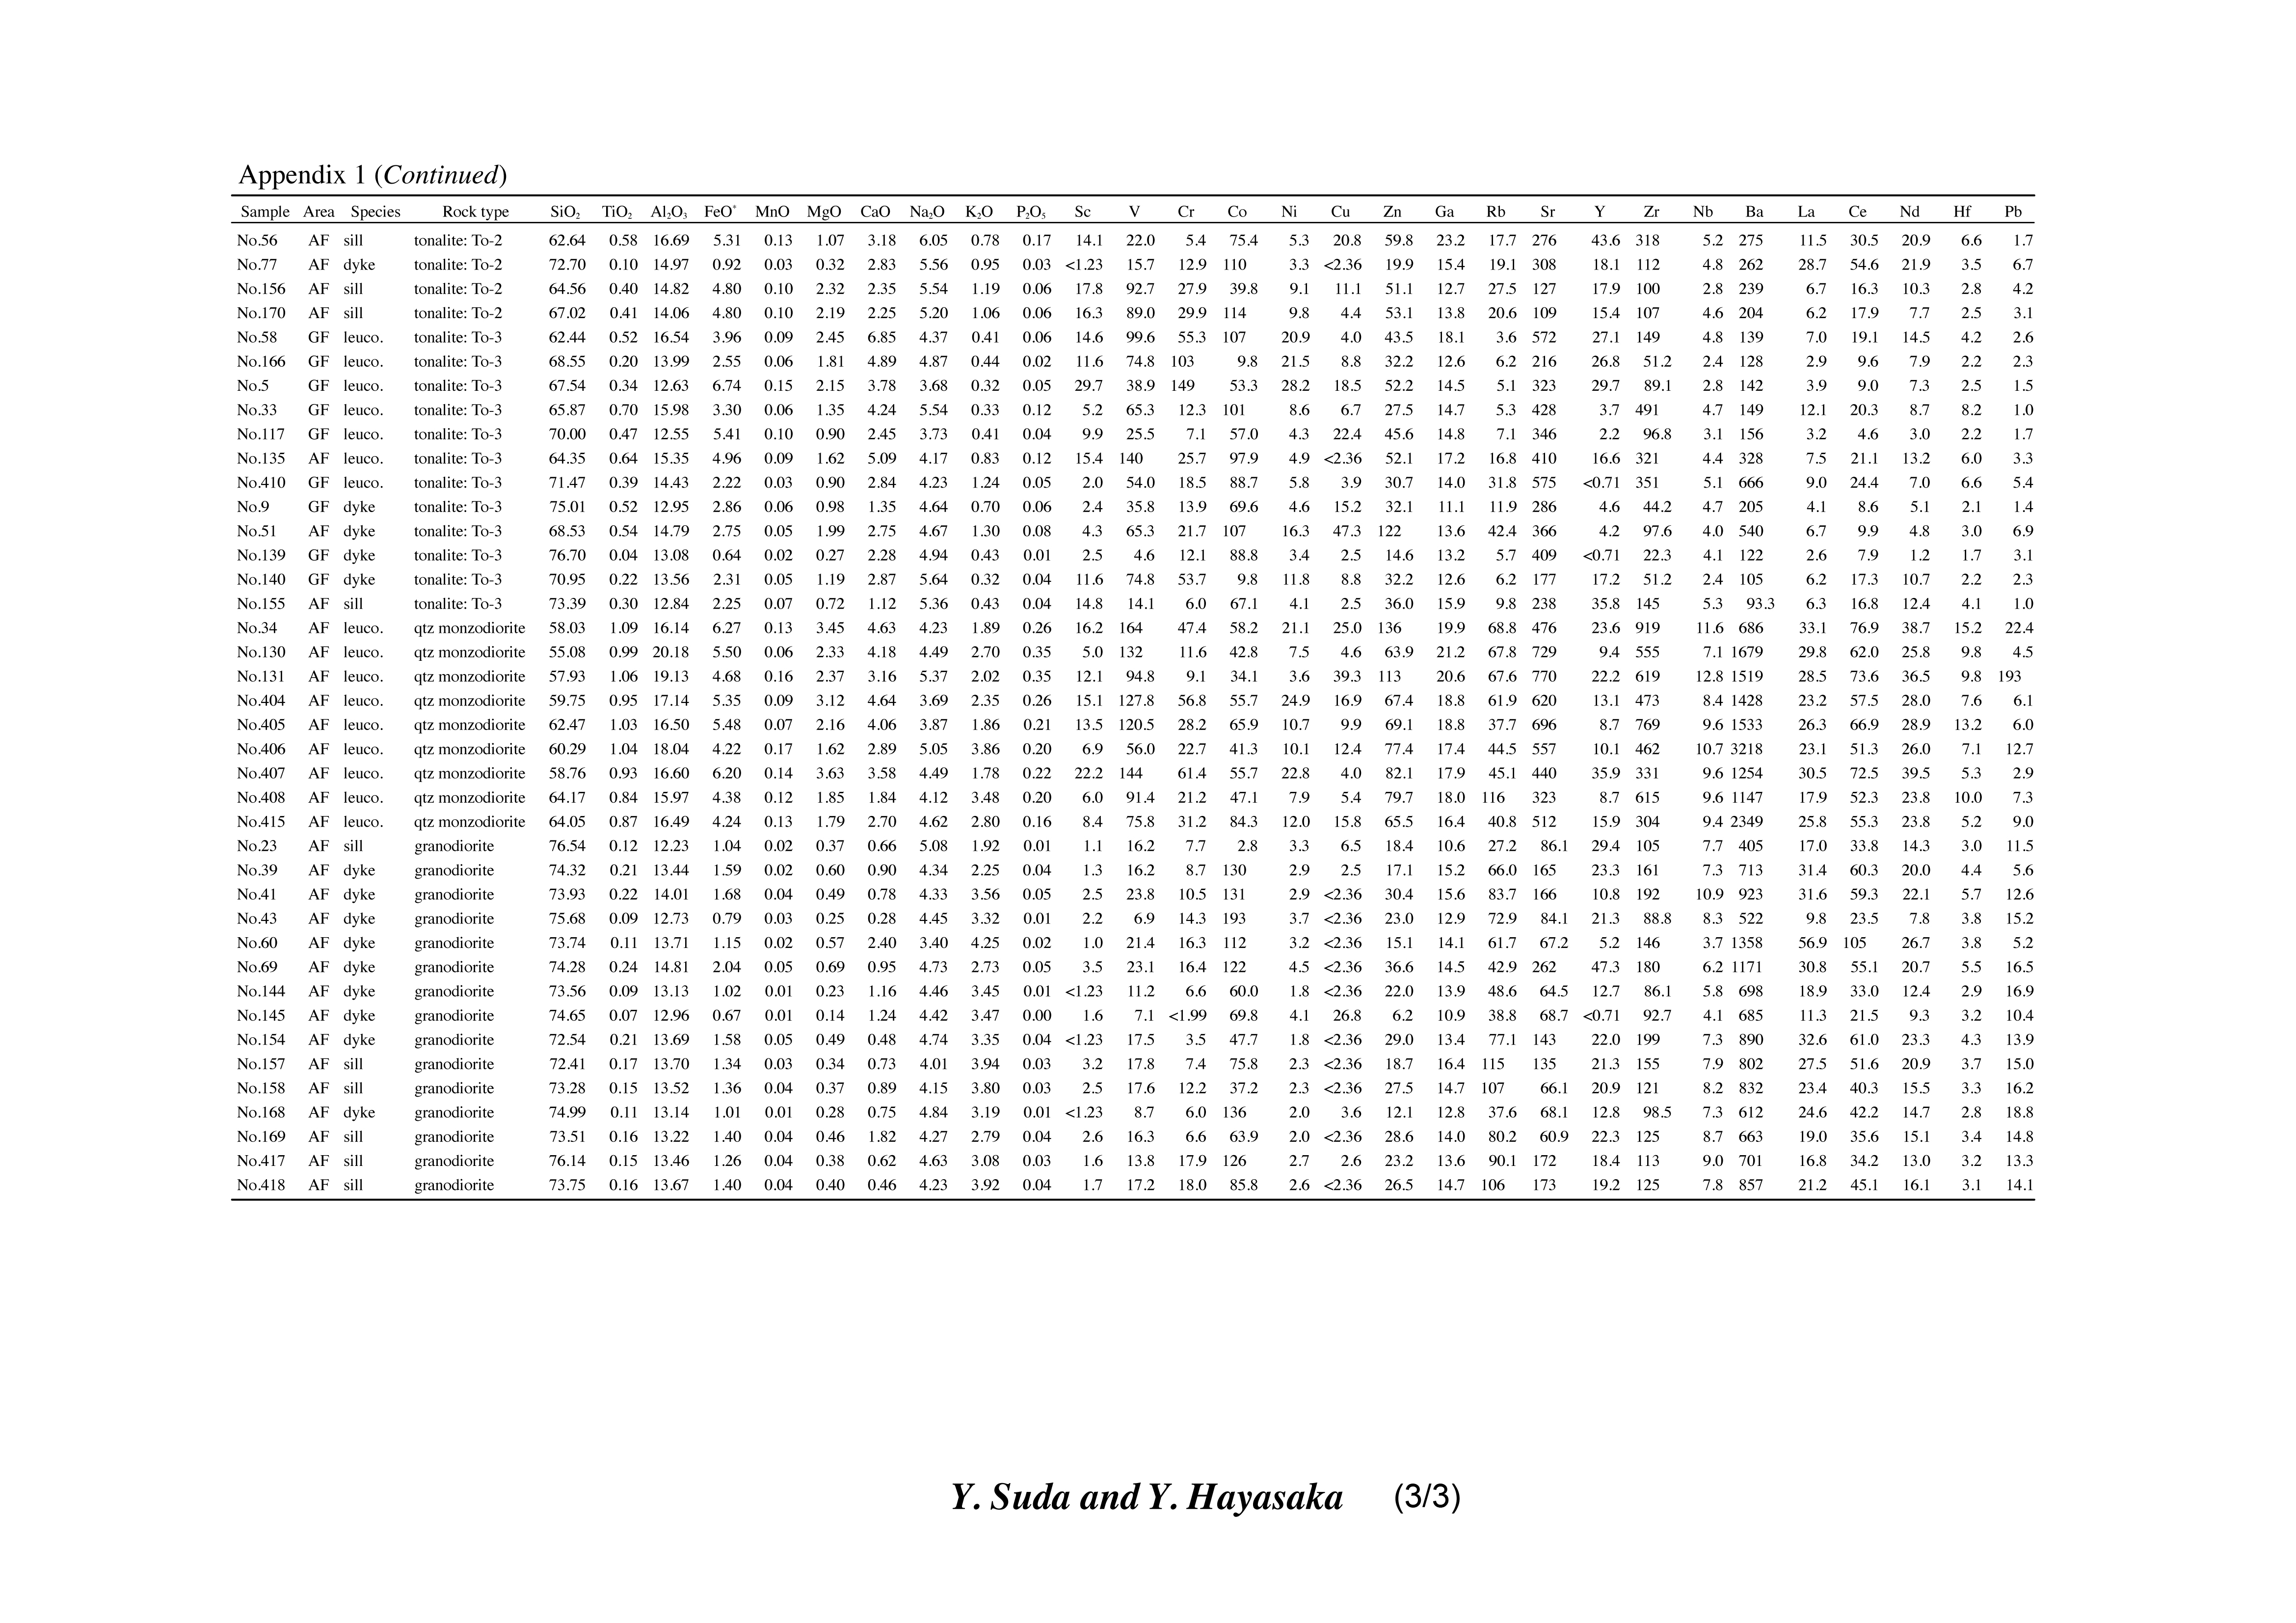
ЂўAppendix 1ЁЁЁЁMajor oxides (in wt. %) and trace elemental abundances (in ppm) for the Yakuno rocks in the Asago body. Total Fe as FeO. Abbreviations: hb mtgb, hornblende metagabbro; amph., amphibolite; qtz monzodiorite, quartz monzodiorite; leuco., leucosome.
Appendix 1-1(PDF) ЁЁЁЁAppendix 1-2(PDF) ЁЁЁЁAppendix 1-3(PDF)
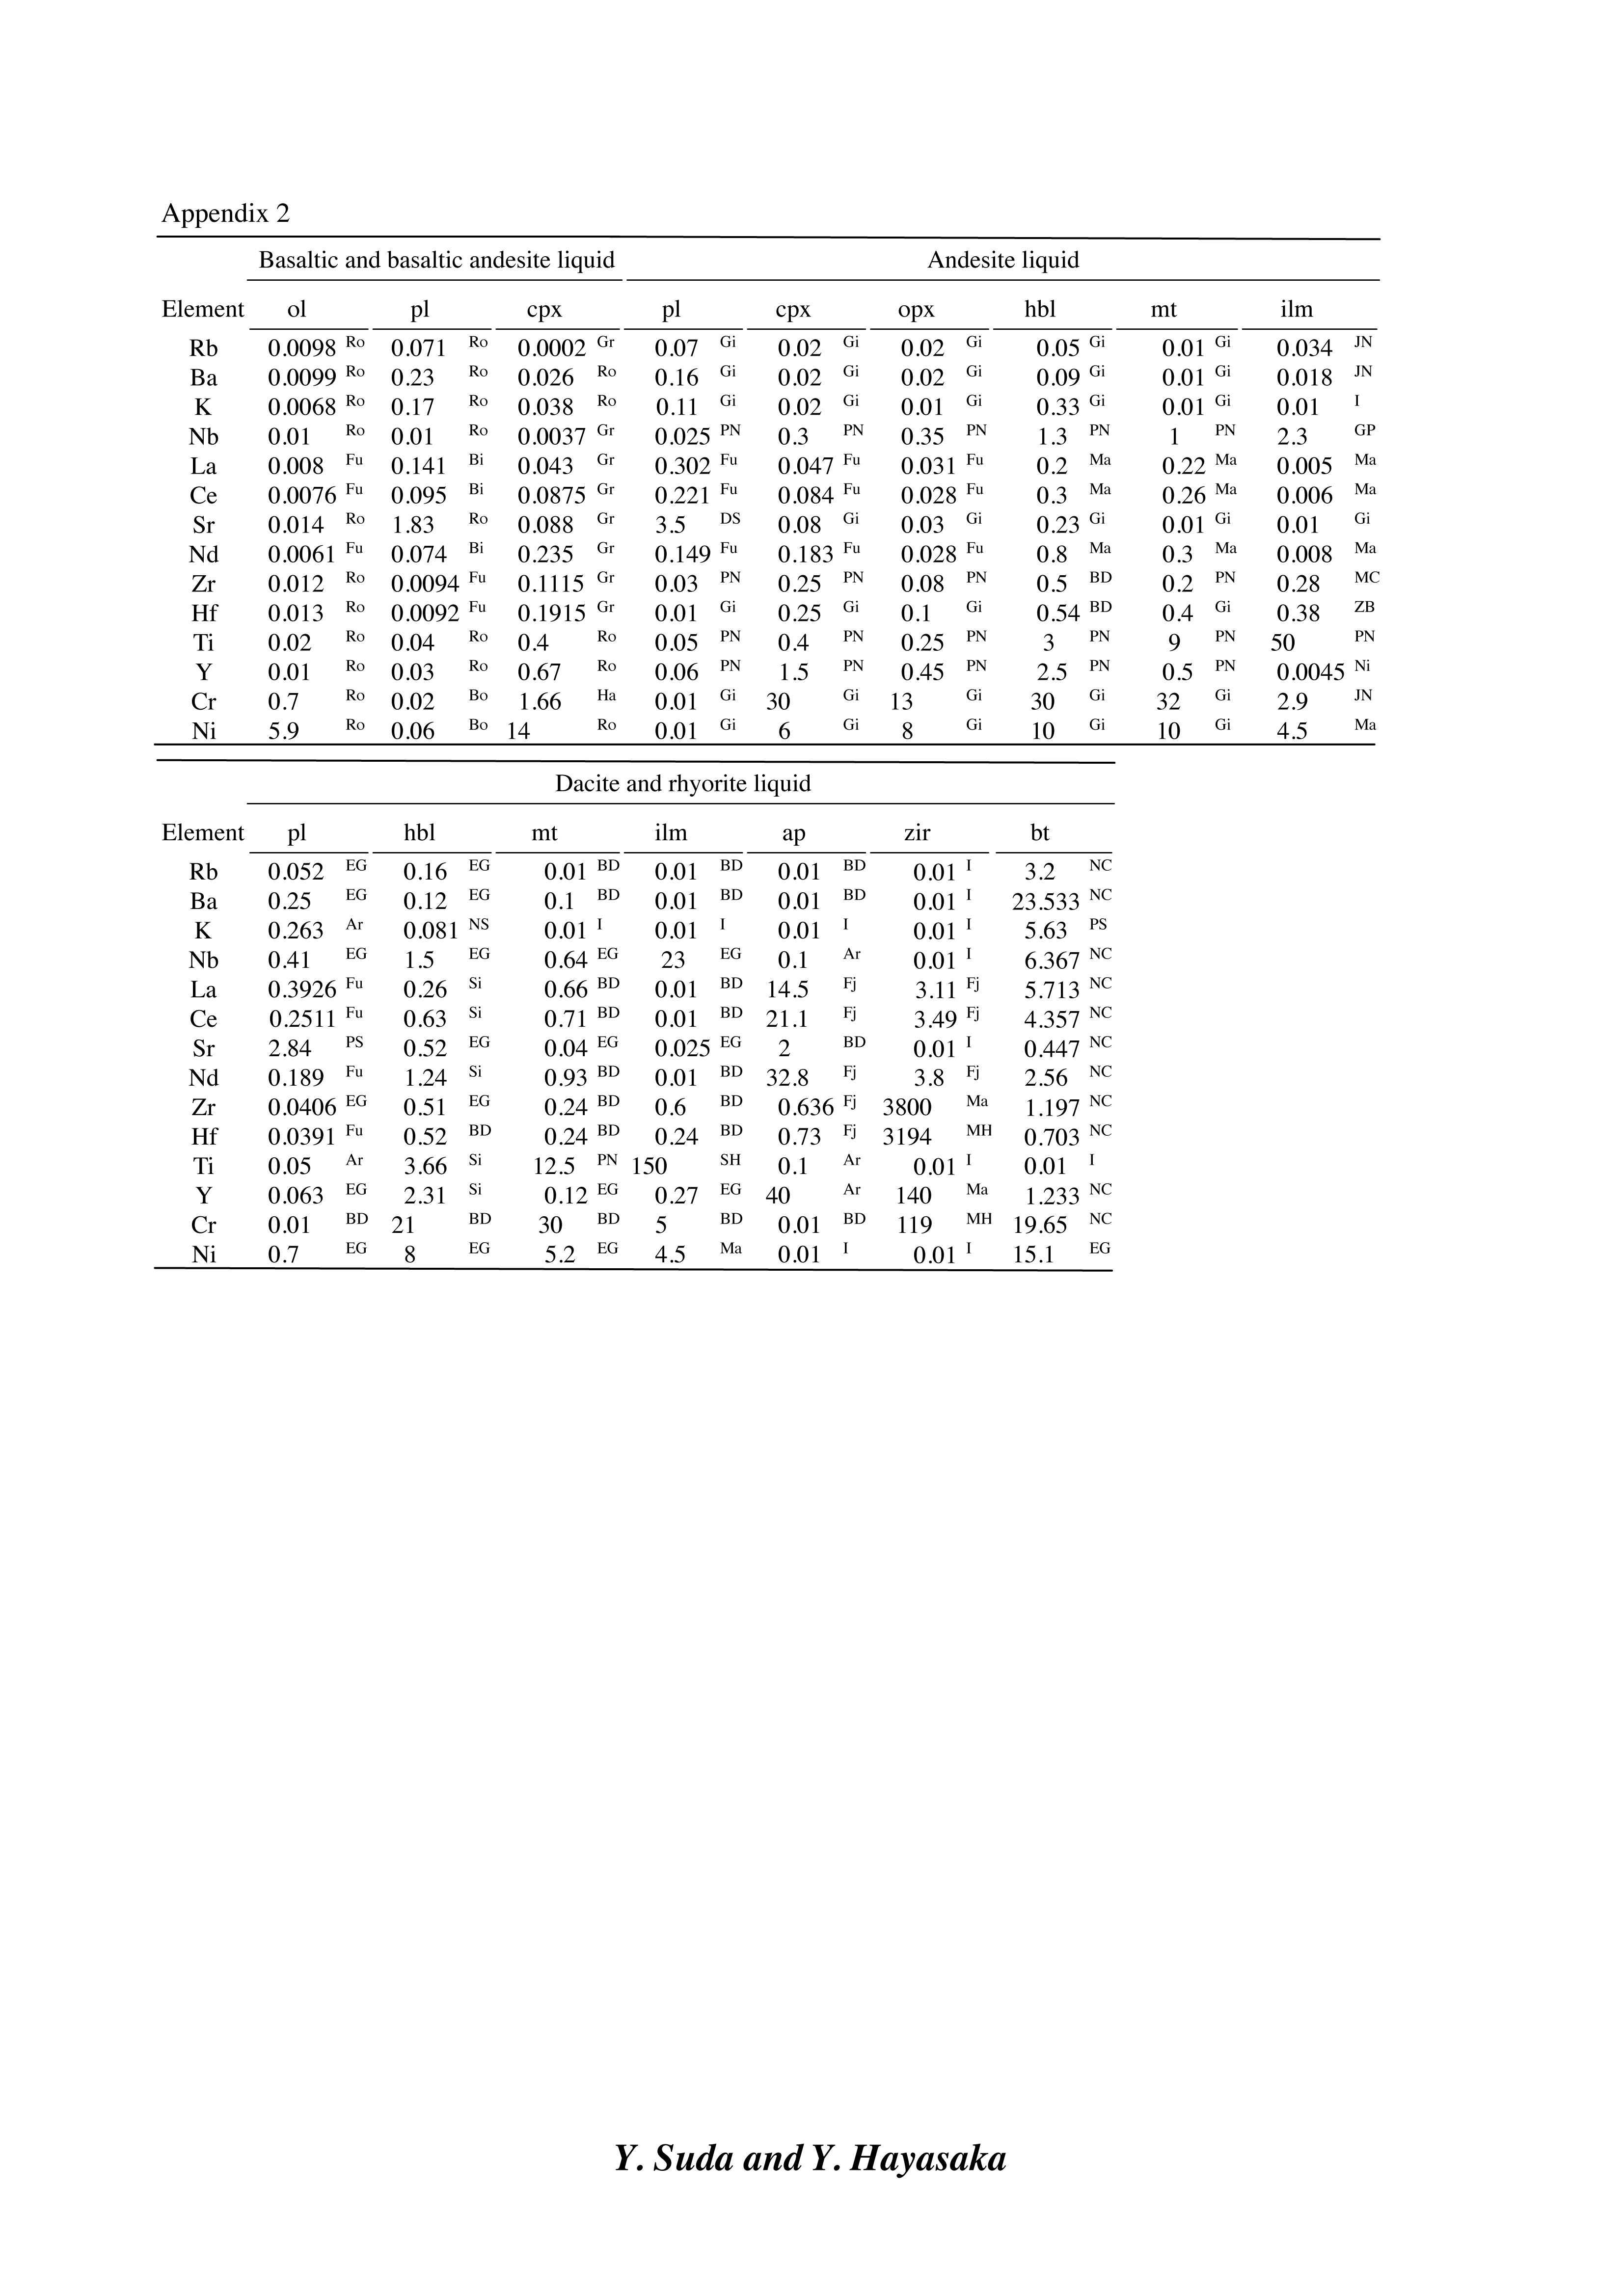
ЂўAppendix 2ЁЁЁЁMineral–melt partition coefficients. Data sources: Ar Arth (1976); BD Bacon and Druitt (1988); Bi Binderman et al. (1998); Bo Bougault and Hekinian (1974); Do Dostal et al. (1983); DS Dunn and Sen (1994); EG Ewart and Griffin (1994); Fj Fujimaki (1986); Fu Fujimaki et al. (1984); Gi Gill (1981); Gr Green et al. (2000); GP Green and Pearson (1987); I interpolated or extrapolated; Ha Hauri et al. (1994); JN Jang and Naslund (2003); MH Mahood and Hildreth (1983); Ma Martin (1987); MC McCallum and Charette (1978); NS Nagasawa and Schnetzler (1971); NC Nash and Crecraft (1985); Ni Nielsen et al. (1992); PN Pearce and Norry (1979); PS Philpotts and Schnetzler (1970); Ro Rollinson (1993); Si Sisson (1994); SH Stimac and Hickmott (1994); ZB Zack and Brumm (1998) Mineral abbreviations: pl, plagioclase; hbl, hornblende; cpx, clinopyroxene; opx, orthopyroxene; mt, magnetite; ilm, ilmenite; ol, olivine; spl, spinel; ap, apatite; zir, zircon; bt, biotite.
ЂўAppendix 3ЁЁЁЁEquations used for modeling. The following equations of Allègre and Minster (1978) have been used for the Rayleigh fractional crystallization model:
Cliq = C0FDi–1 and Ccum = C0(1 – FDi)/(1 – F),
where Cliq is weight concentration in the residual liquid, Ccum is weight concentration in the cumulate F is fraction of residual liquid, C0 is weight concentration in the parental liquid and Di is bulk partition coefficient of crystallizing assemblage for the element. Partition coefficients for basalte and basaltic andesite liquid (Appendix 2) were applied for the modeling of first-stage Yakuno rocks (Figs. 10 and 11), and those for the dacite and rhyolite liquids were applied for the modeling of second-stage Yakuno rocks (Figs. 15 and 17).
The following equation of Shaw (1970) has been used for the equilibrium batch melting model:
CMelt/Ci = 1/(DRS + F(1 – DRS) )
where CMelt is weight concentration in the partial melt, F is fraction of partial melt produced, Ci is weight concentration in the original unmelted solid (i.e. source) and DRS is bulk partition coefficient of the element in the original solid. Partition coefficients for andesite liquid (Appendix 2) were applied for the modeling of partial melting of first-stage Yakuno rocks (Fig. 16).
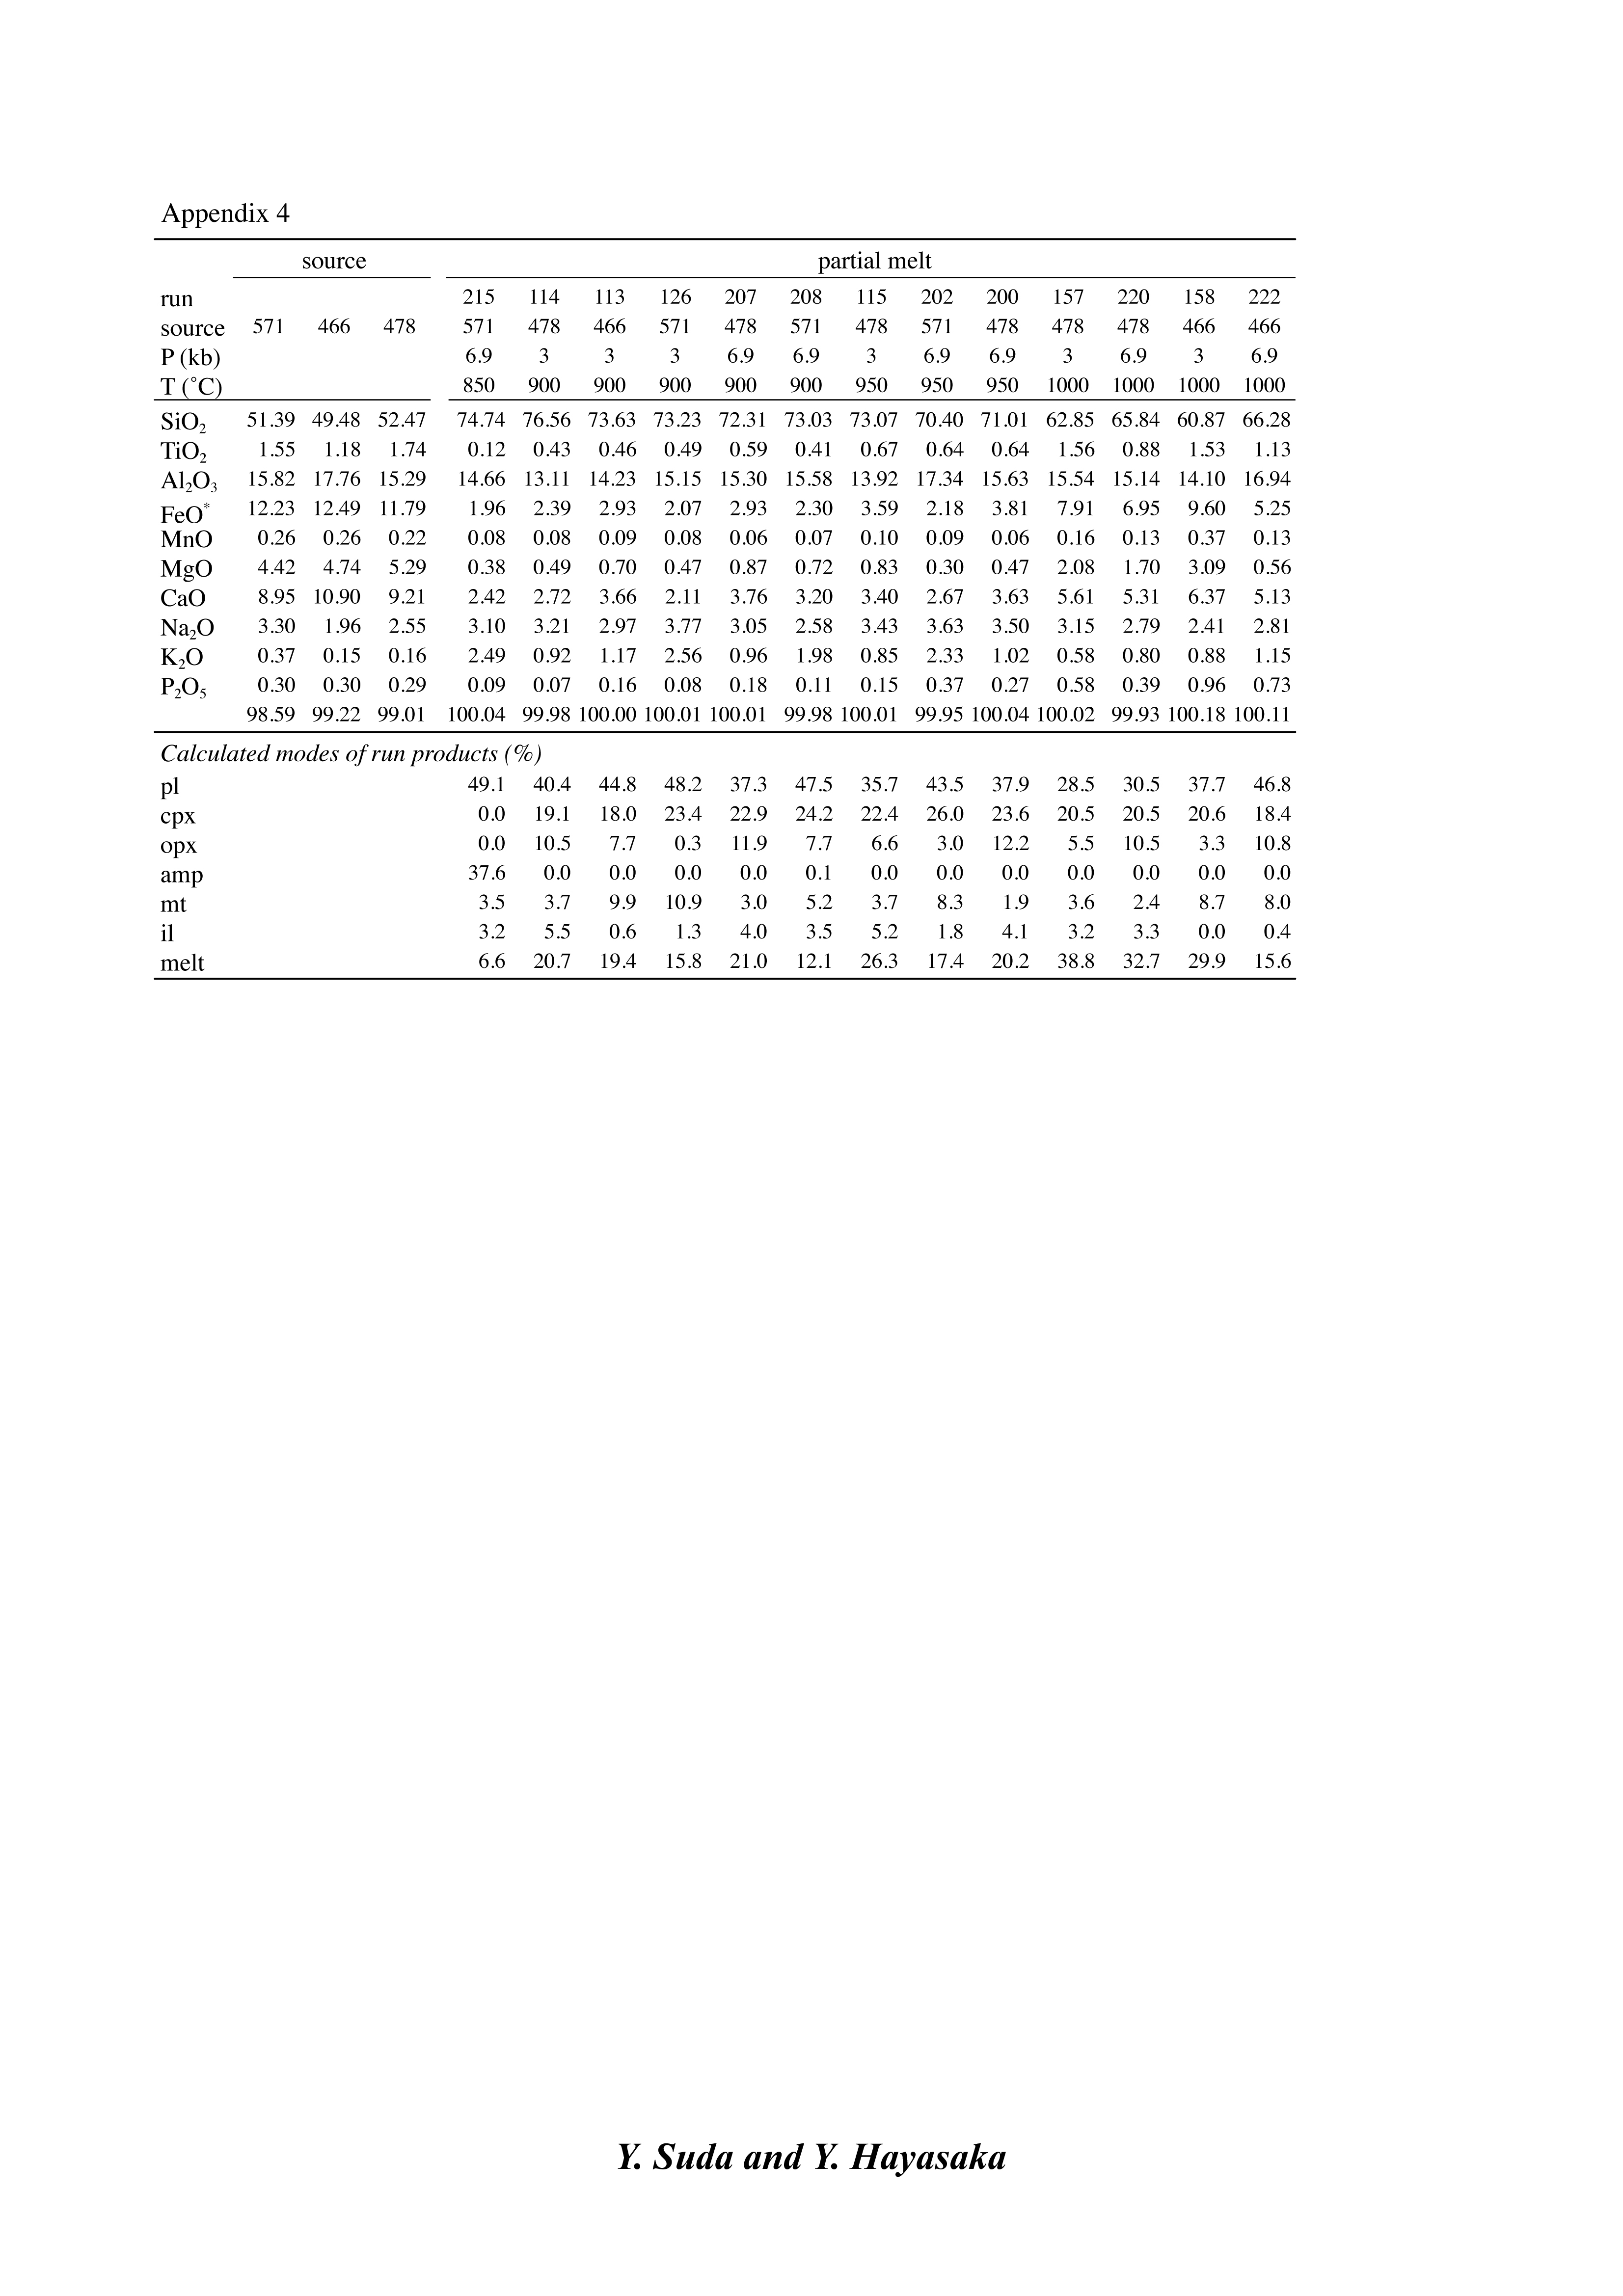
ЂўAppendix 4ЁЁЁЁCompositions of source (starting material) and partial melts (in wt. %), and modes of run products (in %) for the dehydration melting experiment by Beard and Lofgren (1991).
File No14ЁЇvol.115, no.2
ЯРРтЁЇТчКхТЯРбЫпУЯЄЫЄЊЄБЄыУцЩєЙЙПЗХ§ЄЮВжЪДРИСиНјЄШИХДФЖЪбСЋ
ЫмЖПШўКДНя
(vol.115, no.2ЁЁp.64-79.)
ЂўAppendix 1.ЁЁ Correlation of sample numbers with depth in core and sediment type. Pollen extraction procedures (A and B) are explained in the text.
ЂўAppendix 2.ЁЁ Composition of pollen and spores included in each sample. Each pollen frequency (%) is based on total sum of pollen of trees and shrubs.
File No13ЁЇvol.114, no.11
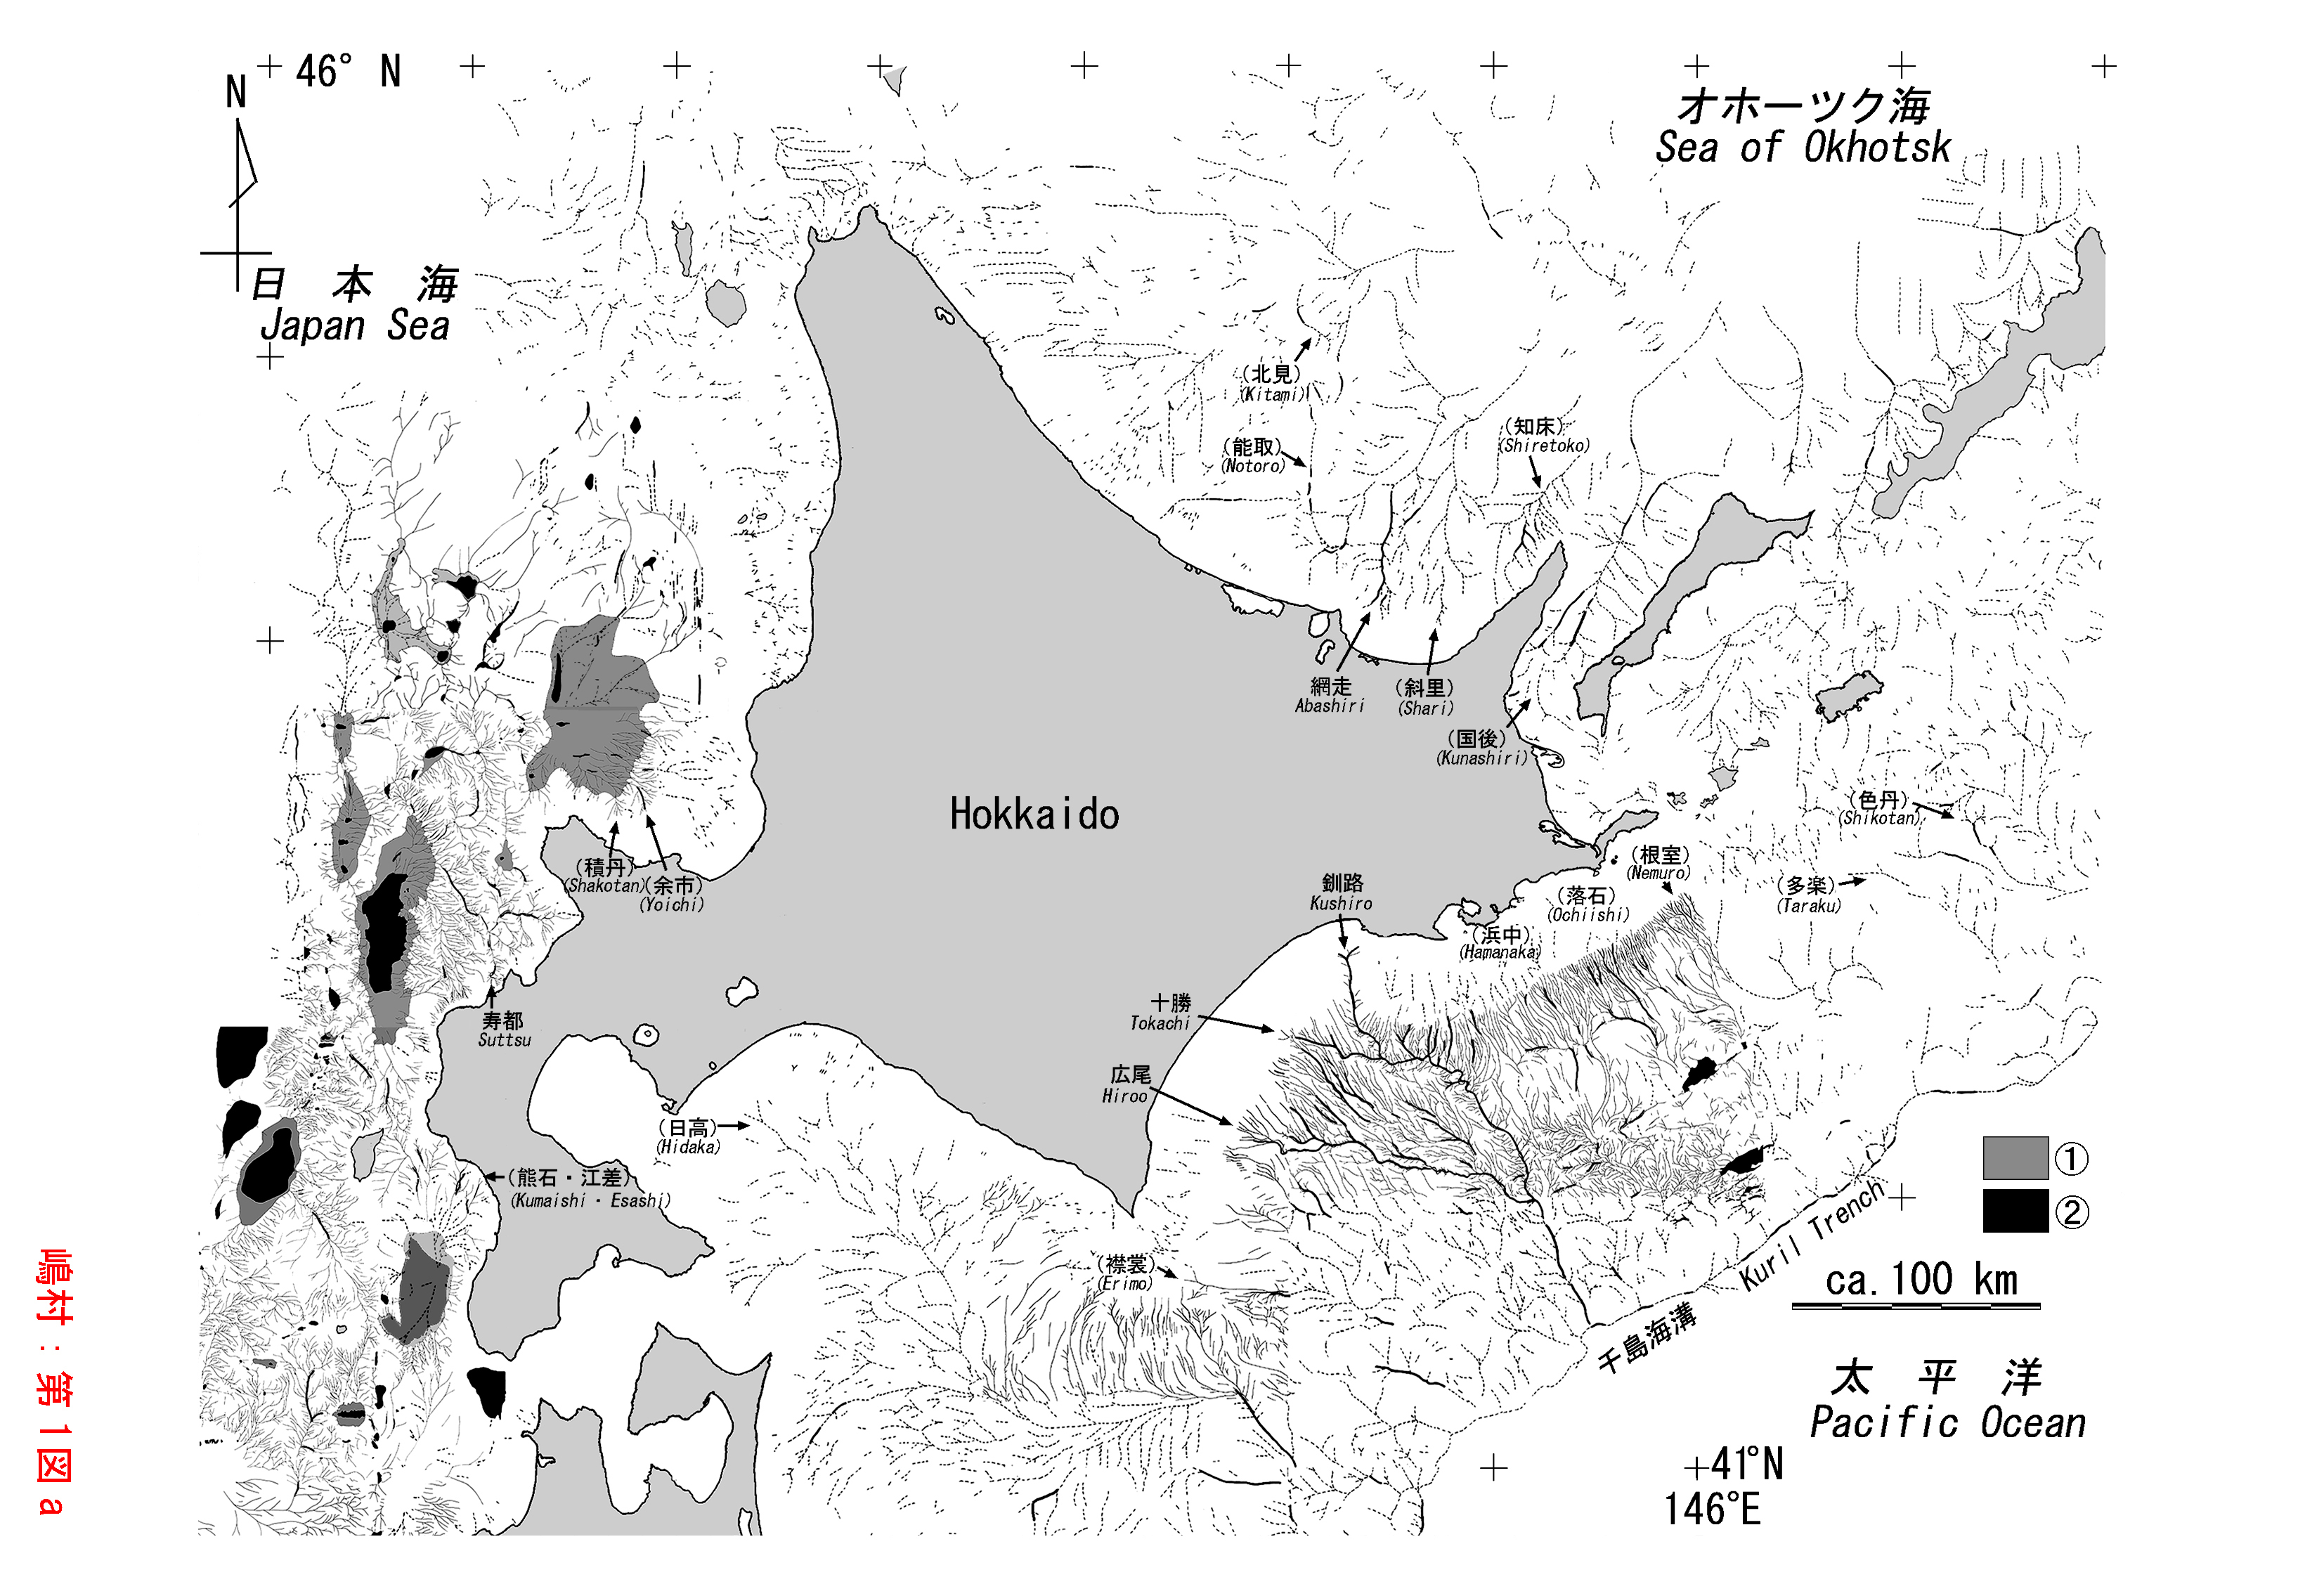
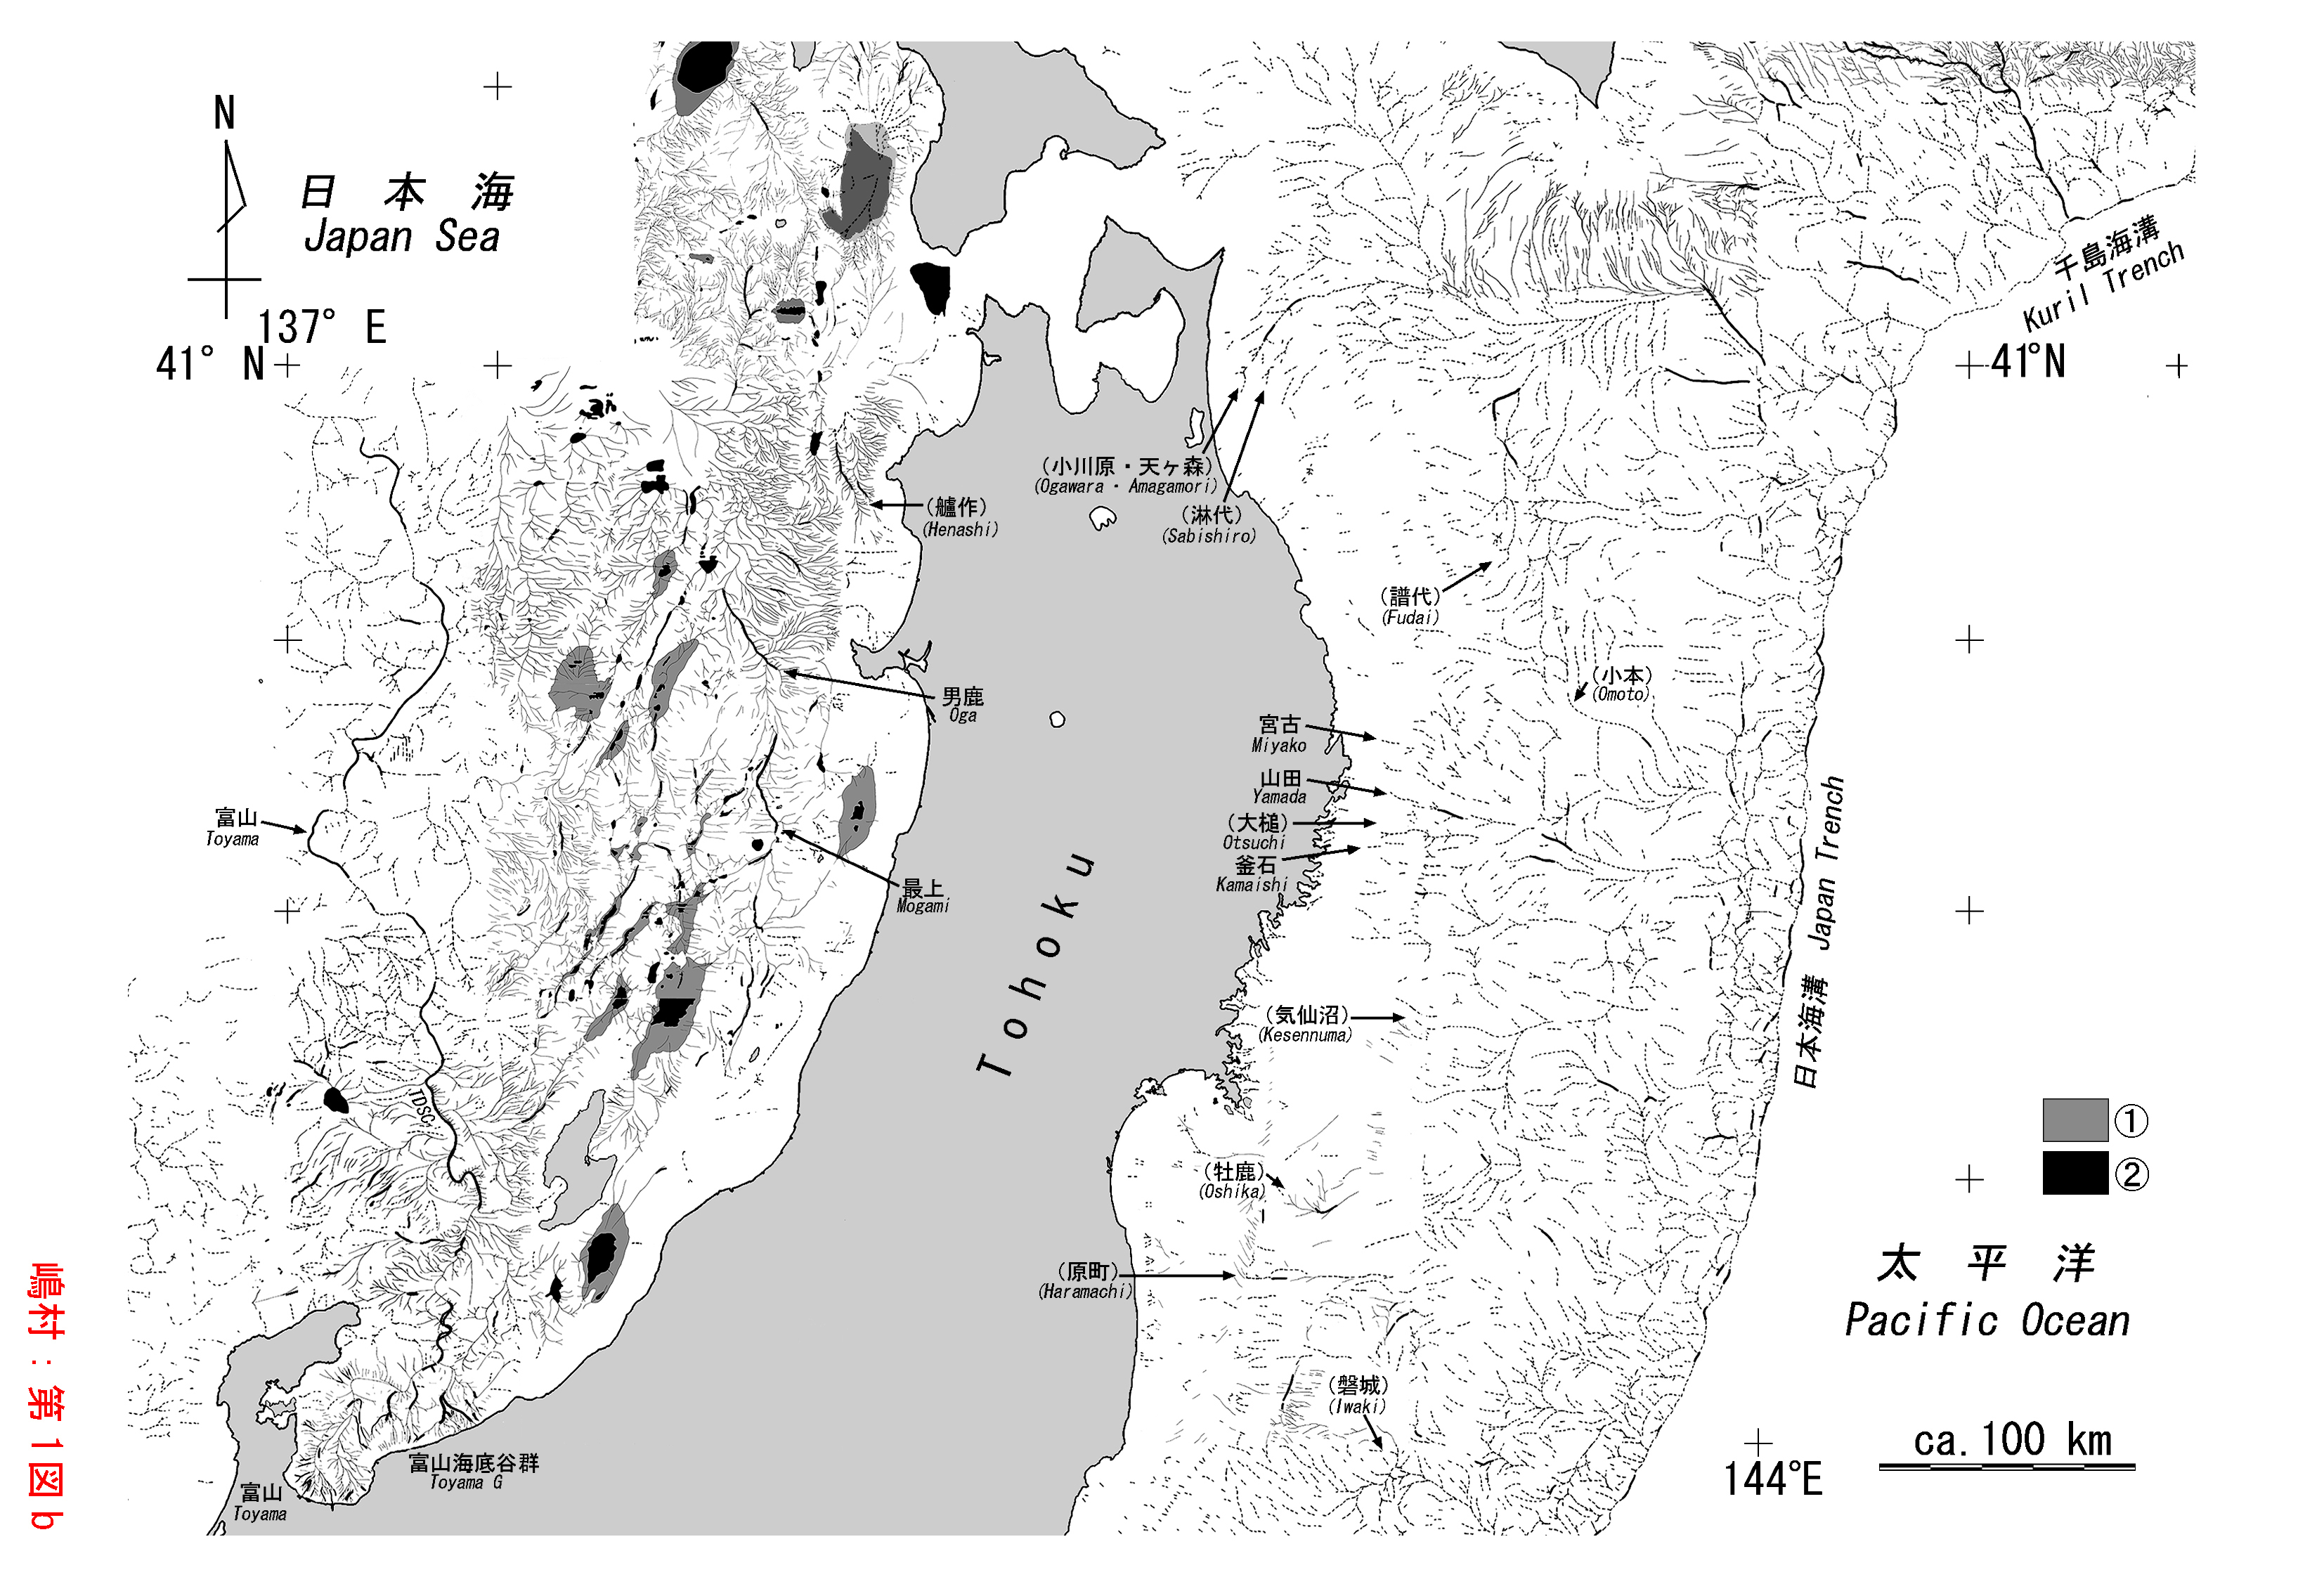
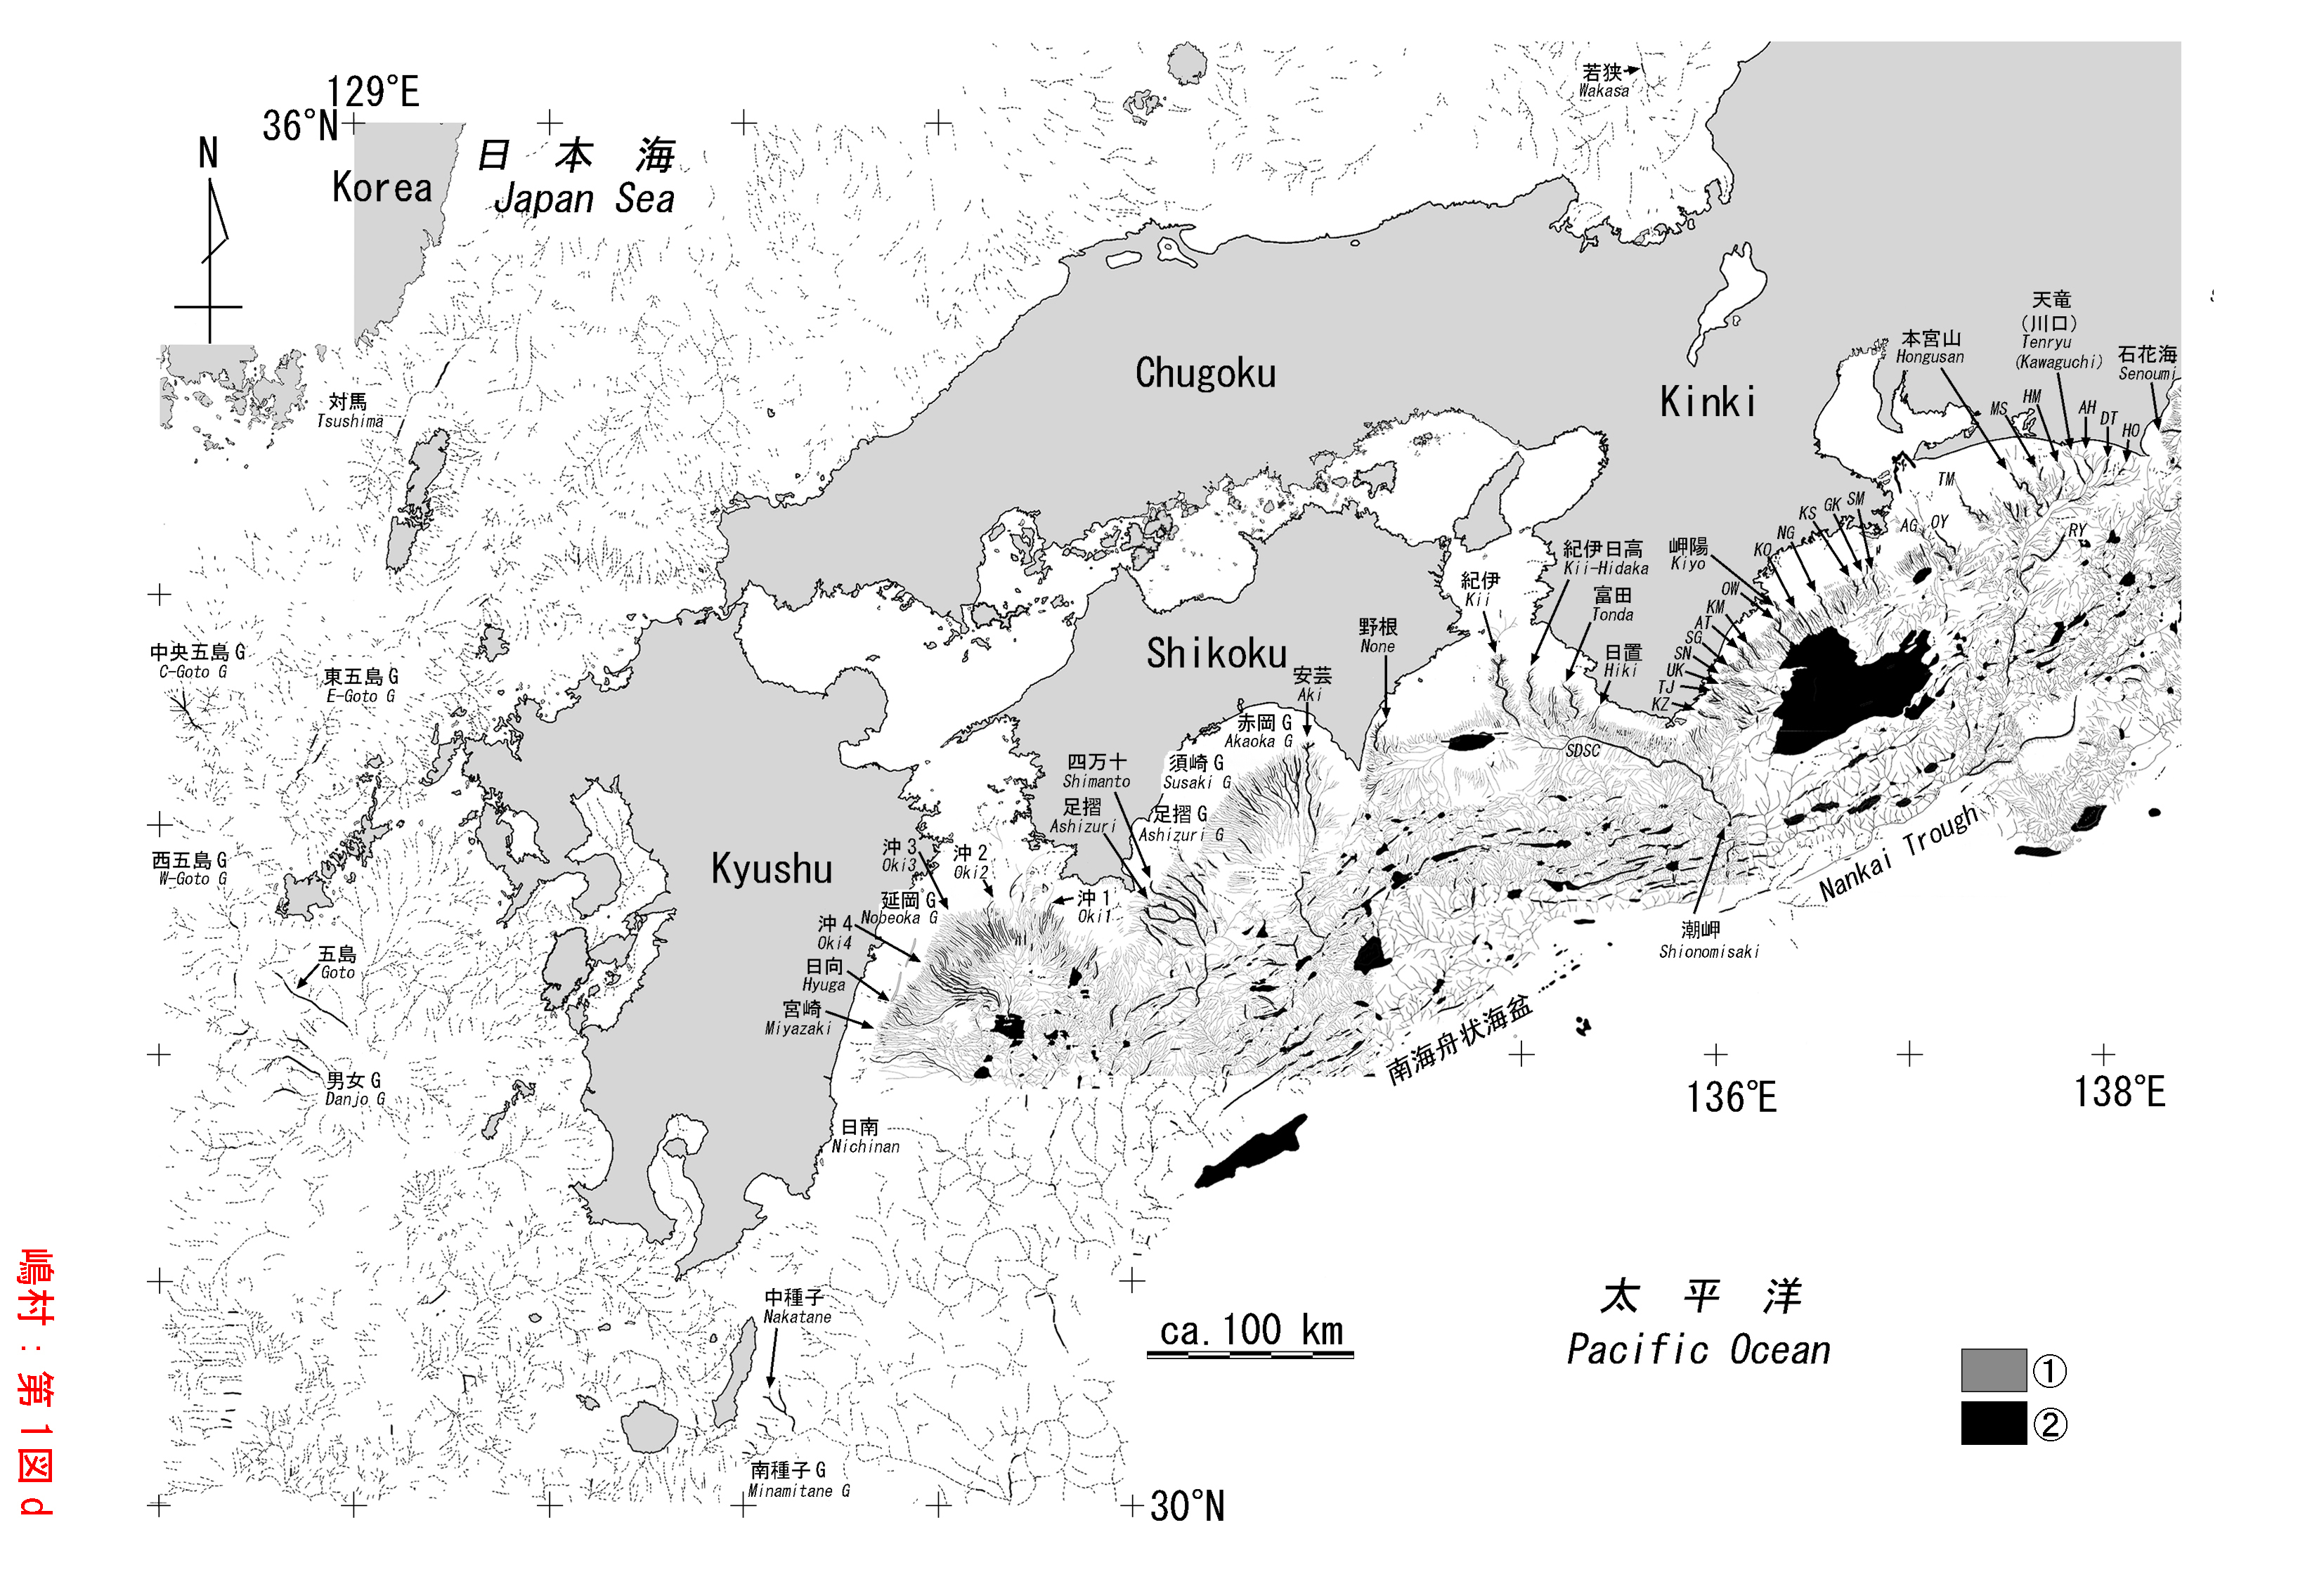
ЯРРтЁЇВўФћЁжЦќЫмЮѓХчГЄФьУЋЗЯПоЁз—ГЄФьУЋЄЮУЯЗСХЊЦУФЇЄШЬфТъХР—
ХшТМЁЁРЖ
(vol.114, no.11ЁЁp.560-576)
ЂўТш1Поa(JPEG)ЁЁЦќЫмЮѓХчГЄФьУЋЗЯПо—ЫЬГЄЦЛВ—.ЁЁУЯЬОЄЯГЄФьУЋЄЮЬООЮЄђМЈЄЙЁЃ1ЁЇГЄЫпЁІБњУЯЁЂ2ЁЇГЄЫпФьЁЪШцПМ50mАЪВМЁЫЁЪАЪВМЁЂЦБЁЫ
ЂўТш1Поb(JPEG)ЁЁЦќЫмЮѓХчГЄФьУЋЗЯПо—ХьЫЬЦќЫмВ—.ЁЁTDSCЁЇЩйЛГПМГЄЅСЅуЅЭЅы
ЂўТш1Поc(JPEG)ЁЁЦќЫмЮѓХчГЄФьУЋЗЯПо—ДиХьЁІУцЩєЁІЖсЕІВ—.ЁЁ
AGЁЇАТОшИ§ГЄФьУЋЁЂAHЁЇРѕБЉГЄФьУЋЁЂATЁЇАЄХФЯТГЄФьУЋЁЂDTЁЇТчХьГЄФьУЋЁЂGKЁЇИоЅіНъГЄФьУЋЁЂHMЁЇЩЭООГЄФьУЋЁЂHOЁЇЩЭВЌГЄФьУЋЁЂJЁЇОыЅіХчГЄФьУЋЁЂKMЁЇЬкЫмГЄФьУЋЁЂKSЁЇПРСАЁЪЄЋЄпЄЕЄЁЫГЄФьУЋЁЂKOЁЇЫЬШјЯЩГЄФьУЋЁЂKTЁЇОЁБКГЄФьУЋЁЂKZЁЇИХКТГЄФьУЋЁЂMRЁЇЩлЮЩЁЪЄсЄщЁЫГЄФьУЋЁЂMSЁЇЩёКфИ§ГЄФьУЋЁЂNDSCЁЇЦюГЄПМГЄЅСЅуЅЭЅыЁЂNGЁЇФЙХчГЄФьУЋЁЂNJЁЇПЗХчГЄФьУЋЁЂOMЁЇТчММГЄФьУЋЁЂOWЁЇШјЯЩГЄФьУЋЁЂOYЁЇТчЛГВГЄФьУЋЁЂRYЁЇЮЕЭЮГЄФьУЋЁЂSDSCЁЇФЌЬЈПМГЄЅСЅуЅЭЅыЁЂSGЁЇПЗЕмГЄФьУЋЁЂSMЁЇЛжЫрГЄФьУЋЁЂSNЁЇКДЬюГЄФьУЋЁЂTJЁЇТРУЯГЄФьУЋЁЂTMЁЇЙтООГЄФьУЋЁЂUKЁЇБЇЕзАцГЄФьУЋ
ЂўТш1Поd(JPEG)ЁЁЦќЫмЮѓХчГЄФьУЋЗЯПо—УцЙёЁІЛЭЙёЁІЖхНЃВ—
AGЁЇАТОшИ§ГЄФьУЋЁЂAHЁЇРѕБЉГЄФьУЋЁЂATЁЇАЄХФЯТГЄФьУЋЁЂDTЁЇТчХьГЄФьУЋЁЂGKЁЇИоЅіНъГЄФьУЋЁЂHMЁЇЩЭООГЄФьУЋЁЂHOЁЇЩЭВЌГЄФьУЋЁЂKMЁЇЬкЫмГЄФьУЋЁЂKSЁЇПРСАЁЪЄЋЄпЄЕЄЁЫГЄФьУЋЁЂKOЁЇЫЬШјЯЩГЄФьУЋЁЂKZЁЇИХКТГЄФьУЋЁЂMSЁЇЩёКфИ§ГЄФьУЋЁЂNGЁЇФЙХчГЄФьУЋЁЂOWЁЇШјЯЩГЄФьУЋЁЂOYЁЇТчЛГВГЄФьУЋЁЂRYЁЇЮЕЭЮГЄФьУЋЁЂSDSCЁЇФЌЬЈПМГЄЅСЅуЅЭЅыЁЂSGЁЇПЗЕмГЄФьУЋЁЂSMЁЇЛжЫрГЄФьУЋЁЂSNЁЇКДЬюГЄФьУЋЁЂTJЁЇТРУЯГЄФьУЋЁЂTMЁЇЙтООГЄФьУЋЁЂUKЁЇБЇЕзАцГЄФьУЋЁЂOki1ЁСOki4ЁЇВЅЮХчВ1ЁС4ГЄФьУЋЁЂУЯЬОЄЮИхЄЮGЄЯГЄФьУЋЗВЄђАеЬЃЄЙЄыЁЃ
File No12ЁЇvol.114, no.10
ЪѓЙ№ЁЇОЎУЧСиЄЋЄщПфФъЄЕЄьЄПЙлОВУЯАшЄЮИХБўЮЯЁЇМЏЛљХчИЉБЪЬюУЯАшЄЮЮу
АњУЯИЖЬюЁІЛГЯЉЁЁЦи
(vol.114, no.10ЁЁp.540-545)
ЂўЩеЯПТш1ЩНЁЅБЪЬюУЯАшЄЋЄщЦРЄщЄьЄПУЧСиЅЙЅъЅУЅзЅЧЁМЅПЁЅЛЄКЏЄЮЪ§ИўЄЯЁЄЛГЯЉЁІТчИЖ(2001)ЄЮНёМАЄЧЕКмЁЅЛЄКЏЄЮЪ§ИўЄоЄПЄЯЪбАЬЅЛЅѓЅЙЄЌЖѕЭѓЄЮЙдЄЯЁЄЩдДАСДЅЧЁМЅПЁЅЁЪPDFШЧЁЫ
ЂўЩеЯПТш1ПоЁЅБЪЬюУЯАшЄЮЅыЁМЅШЅоЅУЅзЁЅУЧСиЅЙЅъЅУЅзЅЧЁМЅПМшЦРУЯХРЄЌЁЄNL1ЄЮЄшЄІЄЫЅЂЅыЅеЅЁЅйЅУЅШ2ЪИЛњЄШПєЛњЄШЄЧЩНЄЕЄьЄЦЄЄЄыЁЅУЧСиЅЧЁМЅПЄЯЩеЯПТш1ЩНЁЅЙёХкУЯЭ§БЁШЏЙд2Ыќ5РщЪЌЄЮ1УЯЗСПоЁжЛЇЫрЙѕЬкЁзЁЄЁжЗЊЬюЁзЁЄЁжБЪЬюЁзЁЄЁжВЃРюЁзЄђЛШЭбЁЅЁЪPDFШЧЁЫ
File No11ЁЇvol.114, no.10
ЯРРтЁЇАЕНЬРЅЙЅЦЅУЅзЄЫЄЊЄБЄыЧЫКеТгЄЮЙНТЄ−ДєЩьИЉШєТЭЛдЄЮРзФХРюУЧСиРОЩєЄЮЮу−
УАБЉРЕЯТЁІХчХФЙЬЛЫЁІЙѕпЗБбМљЁІЛАЮиЦиЛж
(vol.114, no.10ЁЁp.495-515)
ЂўЩеЯПFig. 1. ЁЁTypical X-ray diffraction patterns of smear slides for the <2 μm size fractions of the fault clays. An upper pattern of each figure is treated with ethylene-glycol. cal: calcite, chl: chlorite, ill: illite, kln: kaolinite, py: pyrite, qtz: quartz, sc: smectite, sd: siderite.ЁЪPDFШЧЁЫ
File No10ЁЇvol.113, no.7
ЯРРтЁЇЕЊАЫШОХчЫЬЩєЄЮММРИВаКеЮЎТЯРбЪЊЄШМўЪеЄЫЪЌЩлЄЙЄыЖХГЅДфЄЮТаШцЄЊЄшЄгЄНЄьЄщЄЮЕыИЛЁЇЗкЙлЪЊЖўРоЮЈЄђЭбЄЄЄПЅтЁМЅЩЪЌРЯЄЫЄшЄыЅЂЅзЅэЁМЅС
ЛГВМЁЁЦЉЁІУЩИЖЁЁХАЁІДфЬюБбМљЁІРБЁЁЧюЙЌЁІРюОхЁЁЭЕЁІГбАцФЋОМЁІПЗРЕЭЕОАЁІЯТХФОїЮД
(vol.113, no.7ЁЁp.340-352)
ЂўЩеЯПТш1ПоЁЁЁЁЕЊАЫШОХчЄЫЪЌЩлЄЙЄыУцДќУцПЗРЄЗОФЙМСВаРЎДфЮрЄЋЄщКЮМшЄЗЄП96ЛюЮСЄЮСДЙлЪЊЁЄНХЙлЪЊЁЄЗкЙлЪЊСШЙчЄЛЅтЁМЅЩЪЌРЯЗыВЬЄШЁЄЗкЙлЪЊЄШВаЛГЅЌЅщЅЙЄЮЖўРоЮЈЩбХйЪЌЩлЁЅЗкЙлЪЊСШЙчЄЛЅтЁМЅЩЪЌРЯЗыВЬЄЯЖўРоЮЈШЯАЯЄђ4ЄФЄЫЪЌГфЄЗЁЄФуЖўРоЮЈТІЄЋЄщЅЋЅъФЙРаЁІФуЖўРоЮЈМаФЙРа(ЅЂЅыЅаЅЄЅШЁСЅЊЅъЅДЅЏЅьЁМЅЙ)ЁІРаБбЁІЙтЖўРоЮЈМаФЙРа(ЅЂЅѓЅЧЅЗЅѓЁСЅЂЅЮЁМЅЕЅЄЅШ)ЄШЄЗЄЦЩНЄЗЄПЁЅЁЪPDFШЧЁЫ
ЂўЩеЯПТш2ПоЁЁЁЁЫмИІЕцЄЧЭбЄЄЄП96ЛюЮСЄЮЛюЮСКЮМшУЯХРЁЅЛюЮСЬОЄЯФЬШж+ЛюЮСЕЙцЄЧЩНЄЗЁЄЛШЭбЄЗЄП1/25000УЯЗСПоЬОЄтЄНЄьЄОЄьМЈЄЗЄПЁЅЁЪPDFШЧЁЫ
ЂўЩеЯПТш3ПоЁЁЁЁММРИВаКеЮЎТЯРбЪЊЛюЮСЄђКЮМшЄЗЄПЩДЁЙЅыЁМЅШЄШЮЖИ§ЅыЁМЅШЄЮЅыЁМЅШЅоЅУЅзЁЅЁЪPDFШЧЁЫ
File No9ЁЇvol.113, no.3,
ЯРРтЁЇМЏЛљХчИЉШЌНХЛГУЯАшЄЮУЯМСЄШСЏПЗХ§ЗДЛГСиЄЮСиАЬГиХЊИІЕц
ЦтТМИјТчЁІТчЬкИјЩЇЁІИХпЗЁЁЬРЁЁ (vol.113, no.3 p.95-112.)
ЂўЅЊЁМЅзЅѓЅеЅЁЅЄЅыТш1ЩНЁЁЗОСєВНРаЛКНаАьЭїЩНЁЁЁЪPDFШЧЁЫ
File No8ЁЇvol.112, no.11
ЯРРтЁЇЦќЙтЪбРЎТгМчТгЄЫЪЌЩлЄЙЄыЙтЪбРЎХйГбСЎДфЮрЄЮИЖДфПфФъЄЊЄшЄгЫЬЩєЦќЙтТгЮаПЇДфЮрЄШЄЮШцГг
РюЯВРЛЛжЁІУцЬюПЩЇЁІОЎЛГЦтЙЏПЭЁІВУЁЙШўДВЭКЁІТчЯТХФРЕЬРЁЁЁЪvol.112, no.11ЁЁp.639-653ЁЈЦУНИЙцЁжЦќЙтОзЦЭТгИІЕцЄЮКЧЖсЄЮПЪЪтЁзЁЫ
ЂўAppendix 1. Bulk chemical compositions of amphibolites and greenstones
Fe2O3*; total Fe as Fe2O3. FeO**; total Fe as FeO. LOI; loss on ignition. XMg=Mg/(Mg+Fe). n.d.; not determined. n.a.; not analyzed.
CHMB: central area of the Hidaka metamorphic Belt, nSHMB: Northern part of southern area of the Hidaka metamorphic Belt, sSHMB: southern part of southern area of the Hidaka metamorphic Belt, Sk: Shimokawa area, Tm: Tomuraushi area, Np: Nipesotsu area, Ot: Okutokachi area, Oc: Ochiai area. SH: Shunbetsu river, KB: Koibokushushibichari river, NNC: Nanashino-sawa river, OG: Ogawara-zawa river, BK: Benikaru-zawa river, SS: Sasshibichari river, NO: Nishuomanai-zawa river, SM: Soematsu-zawa river, HB: Hidakahorobetsu river, SG: Sogabetsu river, MM: Menashuman river, NOB: Niobetsu river, SC: Shirochinomi river, MS: Menashunbetsu river, MK: Mukorobetsu river, PN: Panke river, SN: Shinnosukeshunbetsu river, MKT: Mikitonai river, MKI: Mikiinai river, MN: Menashiesanbetsu river, ON: Onarushibe river, FC: Fuchimi river, RB: Rubeshibe river, NK: Nikanbetsu river, ST: Shiitokachi river, NU: Nupun-Tomuraushi river, NP: Nipesotsu river, OA: Ochiaino-sawa river, SI: Shiisopurachi river, UC: Uchino-sawa river, KN: Kanano-sawa river, TM: Tomamu river.
ЂўAppendix 2. REE compositions of amphibolites
Abbreviations are same to those in Appendix 1.
File No7ЁЇvol.112, no.7
СэРтЁЇСШРЎЅЧЁМЅПВђРЯЄЫЄЊЄБЄы0УЭЄЊЄшЄгЗчТЛУЭЄЮАЗЄЄЄЫЄФЄЄЄЦ
ПЗАцЙЈВХЁІТРХФЁЁЕќЁЪvol.112, no.7ЁЁp.439-451)
ЩеЯП1ЁЁДнЄсИэКЙЄЫЄшЄы0УЭЄђУжДЙЄЙЄыЅзЅэЅАЅщЅрЄЮЅНЁМЅЙЅГЁМЅЩЁЅ
PDFШЧ
textШЧ
ЩеЯП2ЁЁЩдХЌЙчХйЄђЗзЛЛЄЙЄыЅзЅэЅАЅщЅрЄЮЅНЁМЅЙЅГЁМЅЩЁЅ
PDFШЧ
textШЧ
File No6ЁЇvol.112, no.6
ЅЮЁМЅШЁЇТаПєШцЫЁЄЫЄЊЄБЄыЕЌГЪВНРЎЪЌСЊФъЅзЅэЅАЅщЅр—Woronow-Love-SchedlЫЁЄЮМЋЦАВН—
ПЗАцЙЈВХЁІТРХФЁЁЕќЁЪvol.112, no.6ЁЁp.430-435ЁЫ
ЁћЩеЯПЁЅWoronow-Love-SchedlЫЁЄђМТЙдЄЙЄыRЭбЅзЅэЅАЅщЅрЅГЁМЅЩЁЅ
PDFШЧ
textШЧ
File No5ЁЇvol.111, no.5, ОЎЮгЄлЄЋ
ЧНХаШОХчЮиХчУЯАшЄЮУцПЗХ§ЄЮСиНјЁІТЯРбДФЖЁІЅЦЅЏЅШЅЫЅЏЅЙ
ОЎЮгЧюЪИЁІЛГЯЉЁЁЦиЁІС§ХФЩйЛЮЭКЁЪvol.111, no.5ЁЁp.000-000)
ЁћТш1ЩНЁЅ
ЗОСєВНРаЅъЅЙЅШЁЅЪнТИОѕЖЗЁЇG, ЮЩЙЅЁЈVP, ЖЫЄсЄЦЩдЮЩЁЅДоЭЮЬЁЇA, ТПЛКЁЈPD, ЗОСєЩЯЛКНаЁЅТИШнЁЇ+, ТИКпЁЈ−, ЩдКпЁЅ
File No4ЁЇvol.110, no.10, ФдПЙ
СШРЎЮпТгЅЏЅэЅрЅЙЅдЅЭЅыЄЋЄщЄпЄПРФГЄМиЬцДфЅсЅщЅѓЅИЅхЄђЙНРЎЄЙЄыМиЬцДфЄЮЕЏИЛ
ФдПЙЁЁМљЁЪvol.110, no.10ЁЇЦУНИЁЁШєТЭГАБяТгИІЕцЄЮПЪХИЄШХИЫОЁЁp591-597)
ЁћFig.2 Colored version
Microtexture of chromitite (BOM-03a) and serpentinite (BOM-03b). (A) Photomicrograph of the occurrence of zoned Cr-spinel in chromitite [Plane polarized light = PPL]. (B) Photomicrograph of enlarged view of the inclusion-rich in zoned Cr-spinel in chromitite [PPL]. (C) X-ray image of Fe (Kα) of Cr-spinel grain of (B). (D) X-ray image of Mg (Kα) of (C). (E) X-ray image of Ti (Kα) of (C). (F) X-ray image of Na (Kα) of (C), showing distribution of pargasitic amphibole inclusions. (G) Photomicrograph of the occurrence of zoned Cr-spinel in serpentinite [PPL]. (H) Back-scattered electron image of the zoned Cr-spinel in serpentinite. Scale bars on each image represent 1 mm. Abbreviations: CrSp = Cr-spinel, Atg = antigorite, Mgs = magnesite.
File No3ЁЇvol.110, no.8, ЙтЖЖЁІЛГВМ
ЙтЖЖЙЇЛАЁІЛГВМПЮЛЪЁЄ2004ЁЄЅщЅЫЁМЅЫЅуЛўЄЮЅьЅЧЅЃЅЊЅщЅъЅЂЅеЅщЅУЅЏЅЙЁЇ1999ЧЏТРЪПЭЮРжЦЛАшРОЩєЁІУцЩєЄЫЄЊЄБЄыЛўЗЯЮѓЪбЦАЄШГЄЭЮДФЖЁЅЁЪvol.110, no.8 p463-479)
ЁћOpen File Table 1.
Lists of the sampled dates and intervals, fluxes of total Radiolaria and their three subgroups (Nassellaria, Spumellaria, Phaeodaria), and diversity indices.
ЁћOpen File Table 2.
Radiolarian species counts (No. shells per microslide) at Shallow and Deep sediment trap depths at Sites MT1, MT2, MT3, and MT5.
ЁћOpen File Table 3.
Radiolarian species fluxes (No. shells m-2 d-1) at Shallow and Deep sediment traps deployed at Sites MT1, MT2, MT3, and MT5 during January-December 1999 in the western and central equatorial Pacific.
ЁћOpen File Table 4.
Radiolarian species count data obtained from core tops (0-0.5 cm) of the multiple cores recovered at four sediment trap sites.
File No2ЁЇvol.109, no.4, Nomura
Ritsuo Nomura,2003, Assessing the roles of artificial vs. natural impacts on brackish lake environments: foraminiferal evidence from Lake Nakaumi, southwest Japan.ЁЪvol.109, no.4 Ѓ№197-214ЁЫ
ЁћAppendix 1. Quantitative data set for factor analysis and the varimax factor score matrix
ЁћAppendix 2. Calculated ages of each sample.
The dotted lines indicate the marked depth and year, which are referred to the construction activities.
ЁћAppendix 3. Communality and factor loadings.
File No.1ЁЇvol.108, no.6, Nomura and Seto
Ritsuo Nomura and Koji Seto, 2002, Influence of man-made construction on environmental conditions in brackish Lake Nakaumi,southwest Japan:Foraminiferal evidence.ЁЪvol.108, no.6 p394-409ЁЫ
ЁћAppendix 1: Foraminiferal species identified in this study.(PDF/16KB)
ЁћAppendix 2: Foraminiferal occurrence at H-1.(PDF/10KB)
ЁћAppendix 3: Foraminiferal occurrence at H-2.(PDF/12KB)
ЛіЬГЛўДжЁЁЗюЭЫЄЋЄщЖтЭЫИсСА9Лў30ЪЌЄЋЄщИсИх6ЛўЁЪХкЦќНЫЁІЧЏЫіЧЏЛЯЄЯЄЊЕйЄпЁЁОмЄЗЄЏЄЯЁЁ>>ЛіЬГНъОвВ№ЁЫ
ЂЉ101-0032 ХьЕўХдРщТхХФЖшДфЫмФЎ2-8-15АцЗхЅгЅы6F >>УЯПоЄЯЄГЄСЄщ
ХХЯУЁЇ03-5823-1150ЁЪТхЩНЁЫ FAX:03-5823-1156